
Fig. 4
- ID
- ZDB-IMAGE-110111-27
- Genes
- Antibodies
- Publication
- Tsujimura et al., 2010 - A single enhancer regulating the differential expression of duplicated red-sensitive opsin genes in zebrafish
- All Figures
- Figures for Tsujimura et al., 2010
|
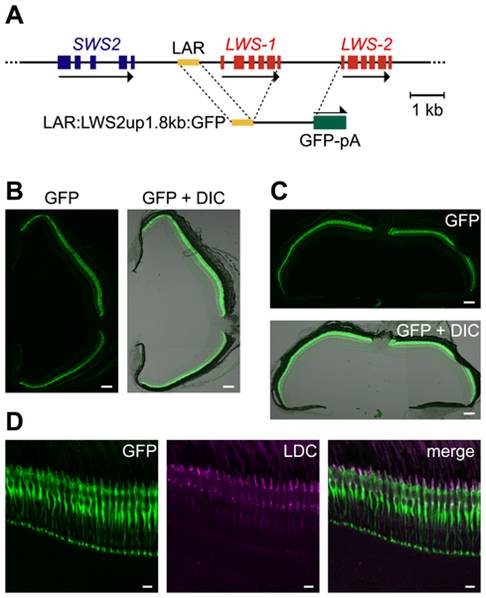
Fig. 4 LDC–specific expression of GFP in the entire retina by LAR:LWS2up1.8kb:GFP.
(A) Schematic representation of the construction of LAR:LWS2up1.8kb:GFP. (B, C) Transverse (B) and horizontal (C) sections of an adult Tg(LAR:LWS2up1.8kb:GFP)#1499 retina. The left (B) and top (C) panels show images of GFP signals (green) and the right (B) and bottom (C) panels show their overlays with the DIC images. The dorsal side is oriented at the top of each panel and the ventral side is at the bottom in (B). The nasal side is on the left and the temporal side is on the right in (C). (D) A vertical and expanded view of the photoreceptor layer from the same eye sample as shown in (B). The left panel shows the GFP signals (green) and the middle panel shows the signals of immunostaining against the zebrafish red opsin in the outer segments of LDCs (magenta). The right panel shows a merge of the left two panels. The overlap of the two signals appears as white. Scale bars = 100 μm for (B, C), 10 μm for (D).