
- Title
-
Visualisation and Quantification of Morphogen Gradient Formation in the Zebrafish
- Authors
- Harvey, S.A., and Smith, J.C.
- Source
- Full text @ PLoS Biol.

Activation of TGF-β Signalling Results in Nuclear Accumulation of Smad2/4 BiFC and Smad2-Venus (A and B) Animal pole cells of 6-hpf transgenic zebrafish embryos that ubiquitously express a Smad2-Venus fusion protein. Nuclei have low levels of Smad2-Venus fluorescence (A), but misexpression of the constitutively active TGF-β receptor Taram-D* results in strong nuclear Smad2-Venus fluorescence (B). (C and C′) Embryos at 6 hpf, previously injected with RNA encoding the VN and VC halves of Venus, pictured under transmitted (C) and UV (C′) light. Arrowheads highlight the nonfluorescent cells on top of the yolk (arrow). (D) Like Smad2-Venus transgenic embryos, the animal pole cells of embryos injected with RNA encoding VNSmad2 (VNS2) and VCSmad4 (VCS4) constructs are devoid of nuclear fluorescence. The arrow highlights intense nuclear fluorescence during cell division. (E) Misexpression of Taram-D* results in strong nuclear Smad2/4 BiFC. (F) Injection of RNA encoding a modified VNSmad2 construct that lacks the TGF-β SXS phosphorylation motif (VNS2ΔSXS) together with RNA encoding VCS4 and Taram-D* does not result in nuclear BiFC. |
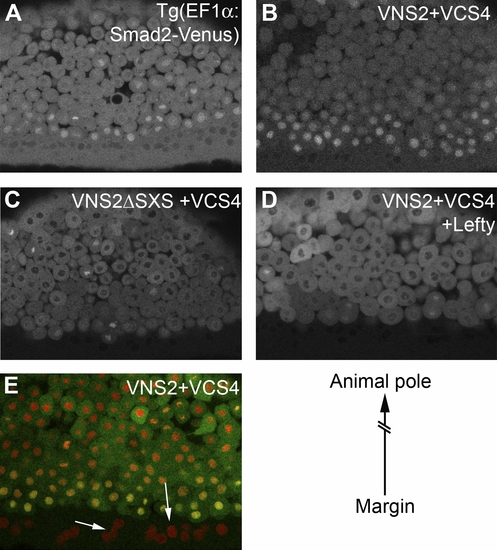
Visualisation of Endogenous Nodal Signalling Images of a Smad2-Venus transgenic embryo (A) and embryos injected with Smad2/4 BiFC constructs (B–E) are shown. Embryos are positioned such that marginal cells are at the bottom of each image, with animal pole cells towards the top (see diagram lower right). Smad2-Venus transgenic embryos (A) and embryos injected with the Smad2/4 BiFC constructs (B) display strong nuclear fluorescence in cells at the margin, while cells positioned nearer to the animal pole do not. (C) Nuclear fluorescence was not observed in the marginal cells of embryos injected with RNA encoding BiFC constructs that lack the TGF-β phosphorylation site (VNS2ΔSXS/VCS4). (D) Nuclear fluorescence in marginal cells was also abolished when embryos were co-injected with RNA encoding Smad2/4 BiFC constructs and the nodal antagonist Lefty (Antivin). (E) An embryo injected with RNA encoding Smad2/4 BiFC constructs (green) and a histone marker (red). Arrows show that nuclei in the YSL are devoid of Smad2/4 BiFC, while the most marginal nuclei show strong Smad2/4 BiFC and therefore appear yellow. |
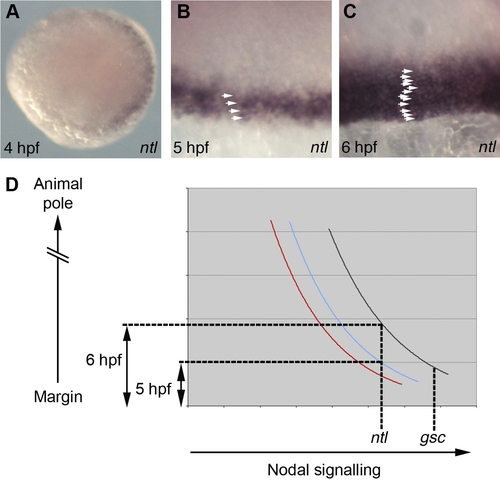
Spatial and Temporal Induction of Nodal Target Genes (A–C) Analysis of ntl expression. (A) Animal pole view of a 4 hpf embryo. (B and C) Views of the margin at 5 hpf (B) and 6 hpf (C) with arrowheads highlighting ntl expressing cells. (D) Graphical representation of Smad2/4 BiFC quantifications in Fig′s 3E-F. Black: 6 hpf dorsal cells; blue: 5 hpf dorsal cells; red: 6 hpf lateral cells. EXPRESSION / LABELING:
|

Levels of Nodal Signalling Specify Dorso-Ventral Pattern (A–F) In situ hybridisation showing expression of gsc in 6 hpf wild-type (WT) embryos (A and E), and embryos injected with increasing concentrations of sqt (B–D, F, and G). (A–D, and G) Animal pole views, with dorsal towards the right of the image, show that increasing concentrations of sqt lead to a ventral expansion of gsc. (E and F) Images of the dorsal side of (A) and (B) show that gsc expression expands towards the animal pole in embryos injected with sqt. (G–I) Correlation of the percentage of embryos that express ectopic gsc with levels of Smad2/4 nuclear BiFC. (G) No ectopic gsc expression is visible in the animal pole (boxed region) of an embryo injected with 2.5 pg of sqt mRNA. (H) Graph showing the percentage of embryos that express gsc in animal pole cells in response to increasing levels of sqt mRNA. Note that significant expression of gsc occurs between 4 pg and 5 pg of injected mRNA. (I) The average intensities of Smad2/4 nuclear BiFC in animal pole cells of embryos injected with the indicated amounts of sqt mRNA, using the same groups of embryos used to quantify gsc expression in (H). Smad2/4 BiFC intensities were normalised by subtracting from the data the average intensity of nuclei in the YSL, derived from Figure 3. Numbers of embryos used for the quantifications of gsc expression (H) were: 5 pg = 103; 4 pg = 58; 3 pg = 58; 2 pg = 112; 1 pg = 36. Numbers used for the quantification of Smad2/4 BiFC intensity (I) were: 5 pg = 20; 4 pg = 8; 3 pg = 14; 2 pg = 16; 1 pg = 6. EXPRESSION / LABELING:
|
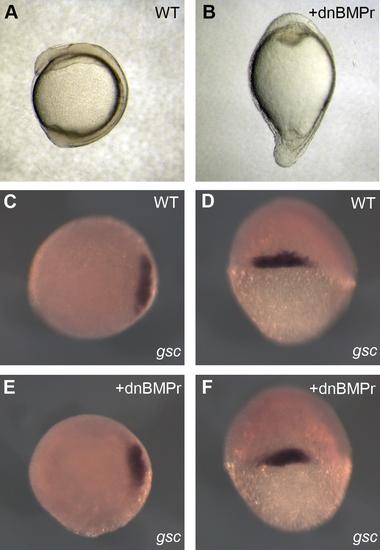
Dorso-Ventral Patterning Is Dependant on Nodal and BMP Signalling (A, C–D) Wild-type embryos. (B, E, and F) Embryos injected with 800 pg of RNA encoding a dominant negative BMP receptor. (A and B) Four-somite stage embryos. (C–F) gsc in situ hybridisation on 6-hpf embryos. (C and E) Animal pole views. (D and F) Dorsal views. EXPRESSION / LABELING:
|