
Image
|
Figure Caption
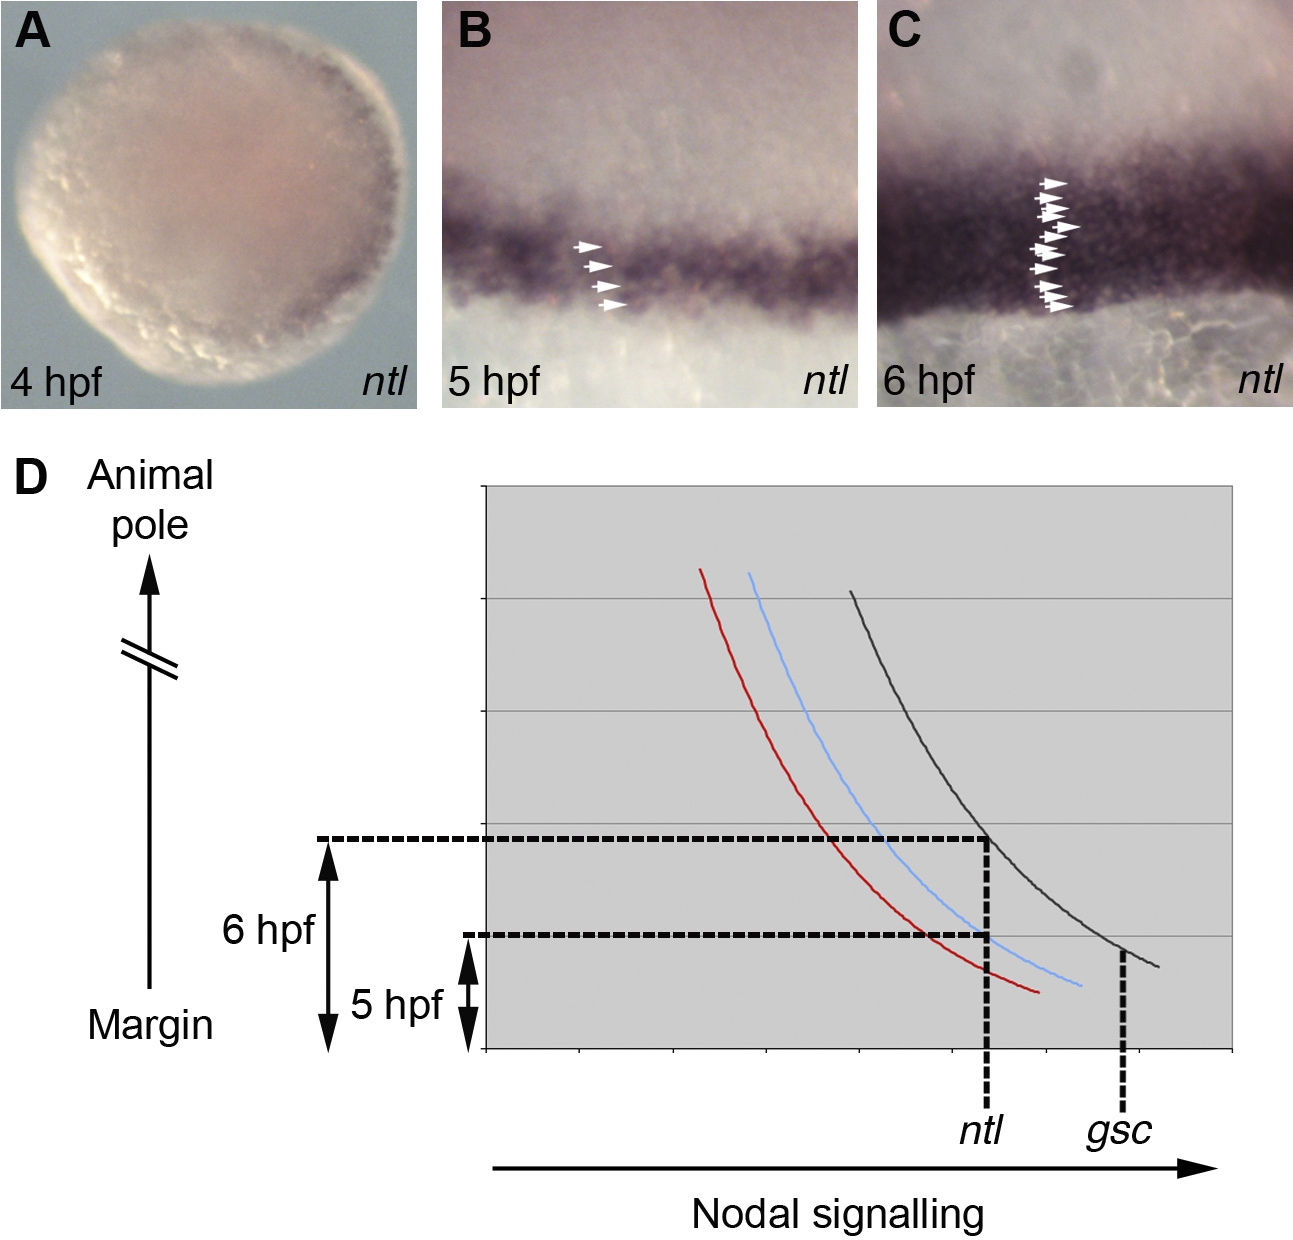
Fig. 4 Spatial and Temporal Induction of Nodal Target Genes
(A–C) Analysis of ntl expression. (A) Animal pole view of a 4 hpf embryo. (B and C) Views of the margin at 5 hpf (B) and 6 hpf (C) with arrowheads highlighting ntl expressing cells.
(D) Graphical representation of Smad2/4 BiFC quantifications in Fig′s 3E-F. Black: 6 hpf dorsal cells; blue: 5 hpf dorsal cells; red: 6 hpf lateral cells.
Figure Data
Acknowledgments
This image is the copyrighted work of the attributed author or publisher, and
ZFIN has permission only to display this image to its users.
Additional permissions should be obtained from the applicable author or publisher of the image.
Full text @ PLoS Biol.