
|
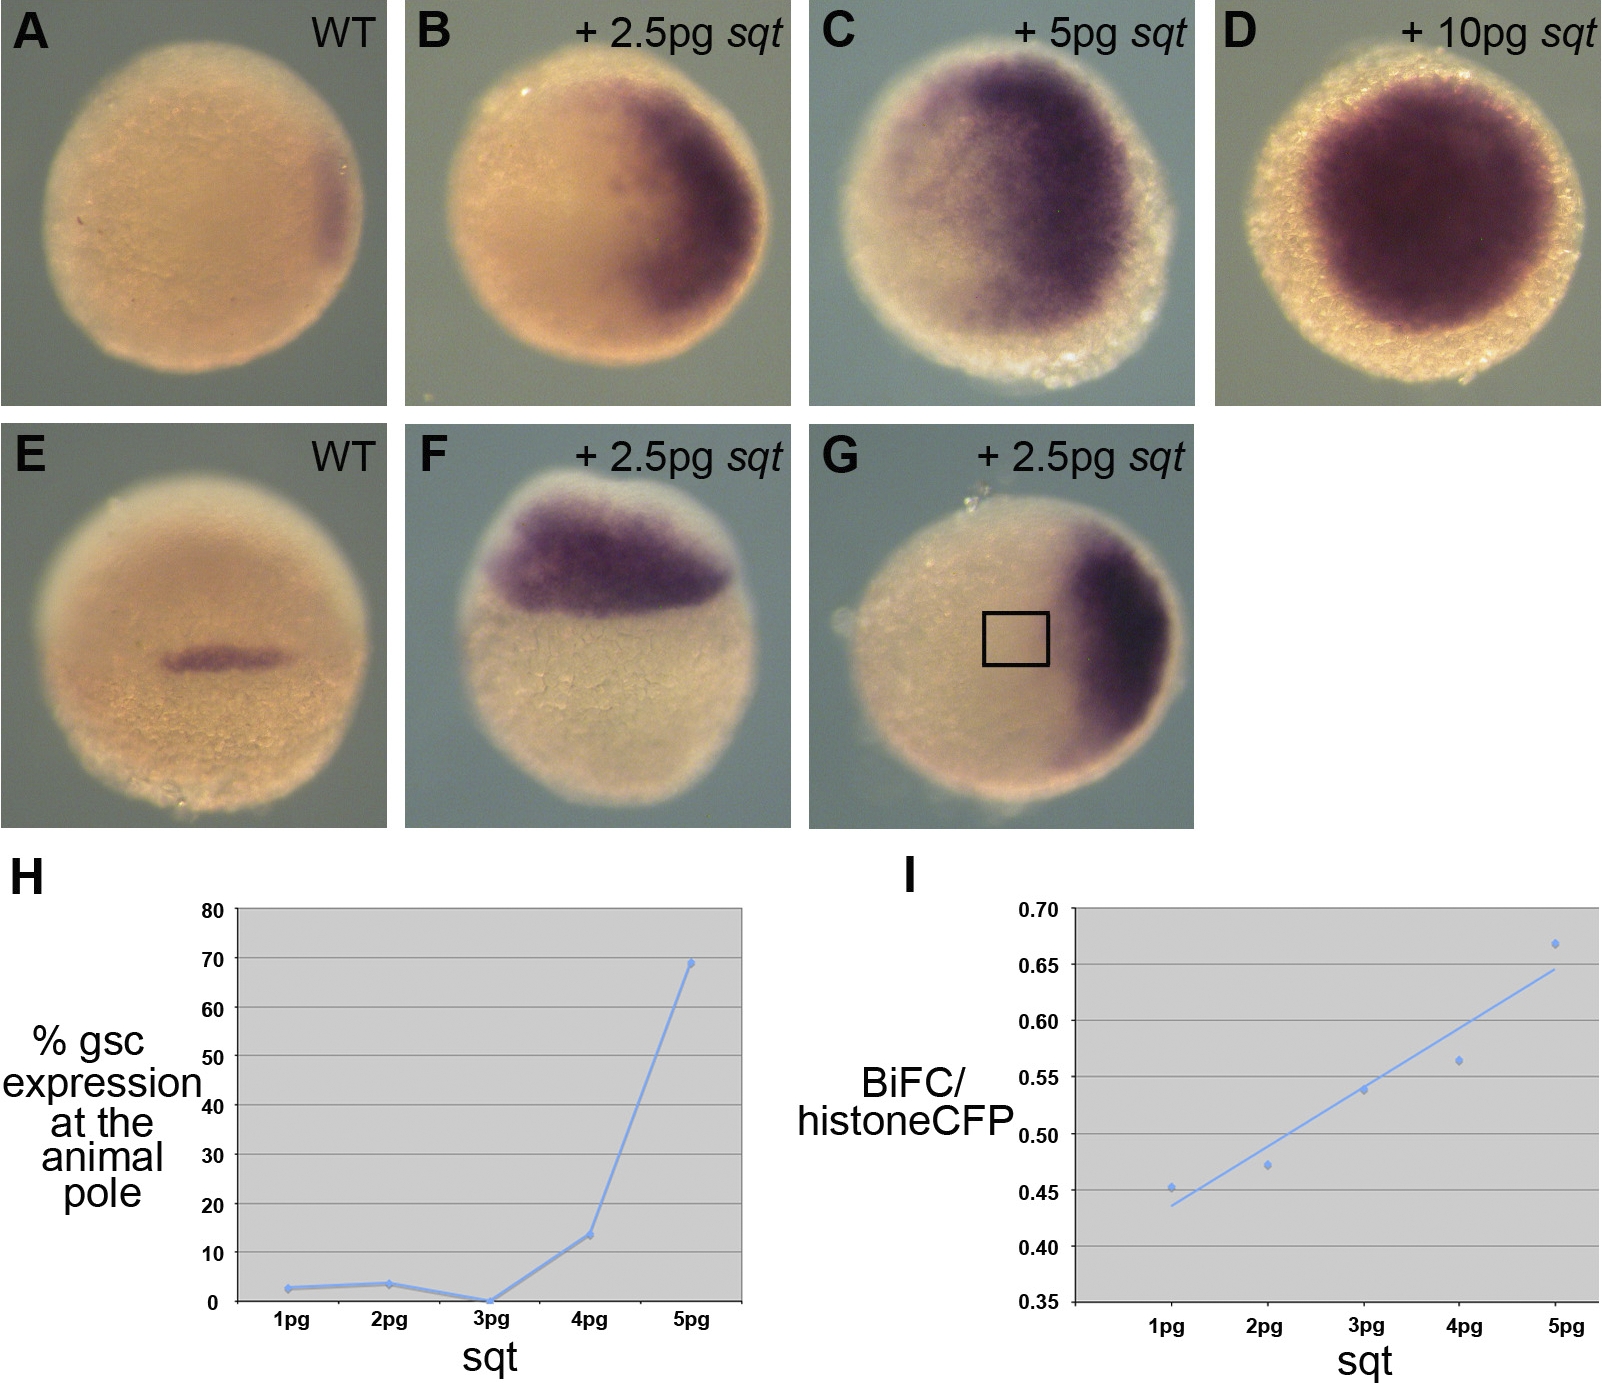
Fig. 5 Levels of Nodal Signalling Specify Dorso-Ventral Pattern
(A–F) In situ hybridisation showing expression of gsc in 6 hpf wild-type (WT) embryos (A and E), and embryos injected with increasing concentrations of sqt (B–D, F, and G). (A–D, and G) Animal pole views, with dorsal towards the right of the image, show that increasing concentrations of sqt lead to a ventral expansion of gsc.
(E and F) Images of the dorsal side of (A) and (B) show that gsc expression expands towards the animal pole in embryos injected with sqt.
(G–I) Correlation of the percentage of embryos that express ectopic gsc with levels of Smad2/4 nuclear BiFC. (G) No ectopic gsc expression is visible in the animal pole (boxed region) of an embryo injected with 2.5 pg of sqt mRNA. (H) Graph showing the percentage of embryos that express gsc in animal pole cells in response to increasing levels of sqt mRNA. Note that significant expression of gsc occurs between 4 pg and 5 pg of injected mRNA. (I) The average intensities of Smad2/4 nuclear BiFC in animal pole cells of embryos injected with the indicated amounts of sqt mRNA, using the same groups of embryos used to quantify gsc expression in (H). Smad2/4 BiFC intensities were normalised by subtracting from the data the average intensity of nuclei in the YSL, derived from Figure 3.
Numbers of embryos used for the quantifications of gsc expression (H) were: 5 pg = 103; 4 pg = 58; 3 pg = 58; 2 pg = 112; 1 pg = 36. Numbers used for the quantification of Smad2/4 BiFC intensity (I) were: 5 pg = 20; 4 pg = 8; 3 pg = 14; 2 pg = 16; 1 pg = 6.