
- Title
-
Identification and characterization of two zebrafish nectin-1 genes that are differentially expressed in the developing eye and brain
- Authors
- Helvik, J.V., Rødahl, E., Drivenes, O., and Haarr, L.
- Source
- Full text @ Dev. Dyn.

RT-PCR analyses of zebrafish nectin-1a and nectin-1b. Expression levels of nectin-1a and nectin-1b were analysed at 128 cells, 7, 10, 12, 14, 16, 20, 24, 28, 32, 36, 48 hpf (marked above each sample) by RT-PCR (A, B) with β-actin as a reference (C). Mw: Fermentas GeneRulerTM 100-bp DNA Ladder. *Maternally contributed mRNA of nectin-1a. |
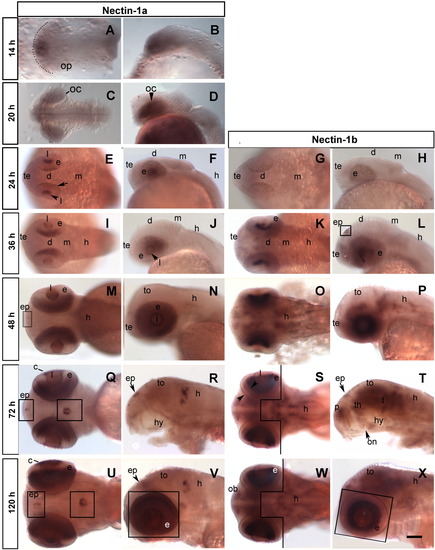
Expression of the nectin-1a and nectin-1b genes in whole mounts of zebrafish at various hours post fertilization (hpf). The stages are indicated to the left and the genes on the top. All preparations are shown in both dorsal (A, C, E, G, I, K, M, O, Q, S, U, W) and lateral views (B, D, F, H, J, N, P, R, T, V, X). The eyes, which are marked with squares in R and T, were removed in N and P. The smaller boxes in M and Q show nectin-1a expression in the brain. Composite images are presented in O and S where the focus planes to the left of the lines were more ventral (lower) than those to the right. c, cornea; d, diencephalon; e, eye; h, hypothalamus; l, lens; m, midbrain; oc, optic; on, optic nerve; op, optic primordial; p, pallium cup; s, subpallium; t, tegumentum; te, telencephalon; th, thalamus; to, tectum opticum. Scale bar = 100 μm. EXPRESSION / LABELING:
|

Nectin-1 expression in cryosections of the eyes of zebrafish, mouse, and human. The tissues were from 120 hpf (A-F) and 20-day-old zebrafish (H, I, S, T), adult mouse (K-P, R), and human (Q). The labelled boxes in the drawings of a 20-day-old zebrafish (G) and adult mouse (J) eyes show the positions from which the tissues in the similarly labelled panels were taken. Enlarged areas of the transverse sections in A and C are shown in C-F. Comparable sections of retinas from human (Q), adult mouse (R), and zebrafish (S = H and T = I) are arranged side by side at the bottom. In situ hybridisations are as follows: nectin-1a in A, C, D, H, K, M, O, and S; nectin-1b in B, E, F, I, and T; mouse nectin-1 antisense probe in K, M, O, Q, and R; and mouse nectin-1 sense probe in L, N, and P. cmz, marginal zone; gcl, ganglion cell layer; inl, inner nuclear layer; ipl, inner plexiform layer; l, lens; onl, outer nuclear layer; os, photoreceptors. Scale bars = 50 μm. EXPRESSION / LABELING:
|

Expression of nectin-1a and nectin1-b in cryosections of zebrafish brain at 120 hpf. Whole mounts are shown in dorsal (A, F, G) or lateral views (I). The eyes were removed in E, G, and I. B, C: Enlargements of the similarly labelled boxed areas in A. Cryosections in D and E are at the positions of the white lines in A. The focus planes in F and G are different, and a composite drawing of the staining is shown in H. I shows the position of the cryosections presented in J-Q. R: A sagittal cryosection. The genes are indicated. Abbreviations are: cep, cerebellar plate; ep, epiphysis; h, hypothalamus; hc, caudal hypothalamus; m, migrated posterior tubercular area; mhb, midbrain-hindbrain boundary; mo, medulla oblongata; ob, olfactory bulb; oe, olfactory epithelium; p, pallium; po, preoptic region; rve, rombecephalic ventricle; s, subpallium; t, tegmentum; th, thalamus; to, tectum opticum; va, valvula cerebelli. Scale bars = 50 μm (B and C), 100 μm (D,E, J-R), and 200 μm (A and F-I). EXPRESSION / LABELING:
|