
Fig. 7
- ID
- ZDB-IMAGE-090113-48
- Genes
- Publication
- Helvik et al., 2009 - Identification and characterization of two zebrafish nectin-1 genes that are differentially expressed in the developing eye and brain
- All Figures
- Figures for Helvik et al., 2009
|
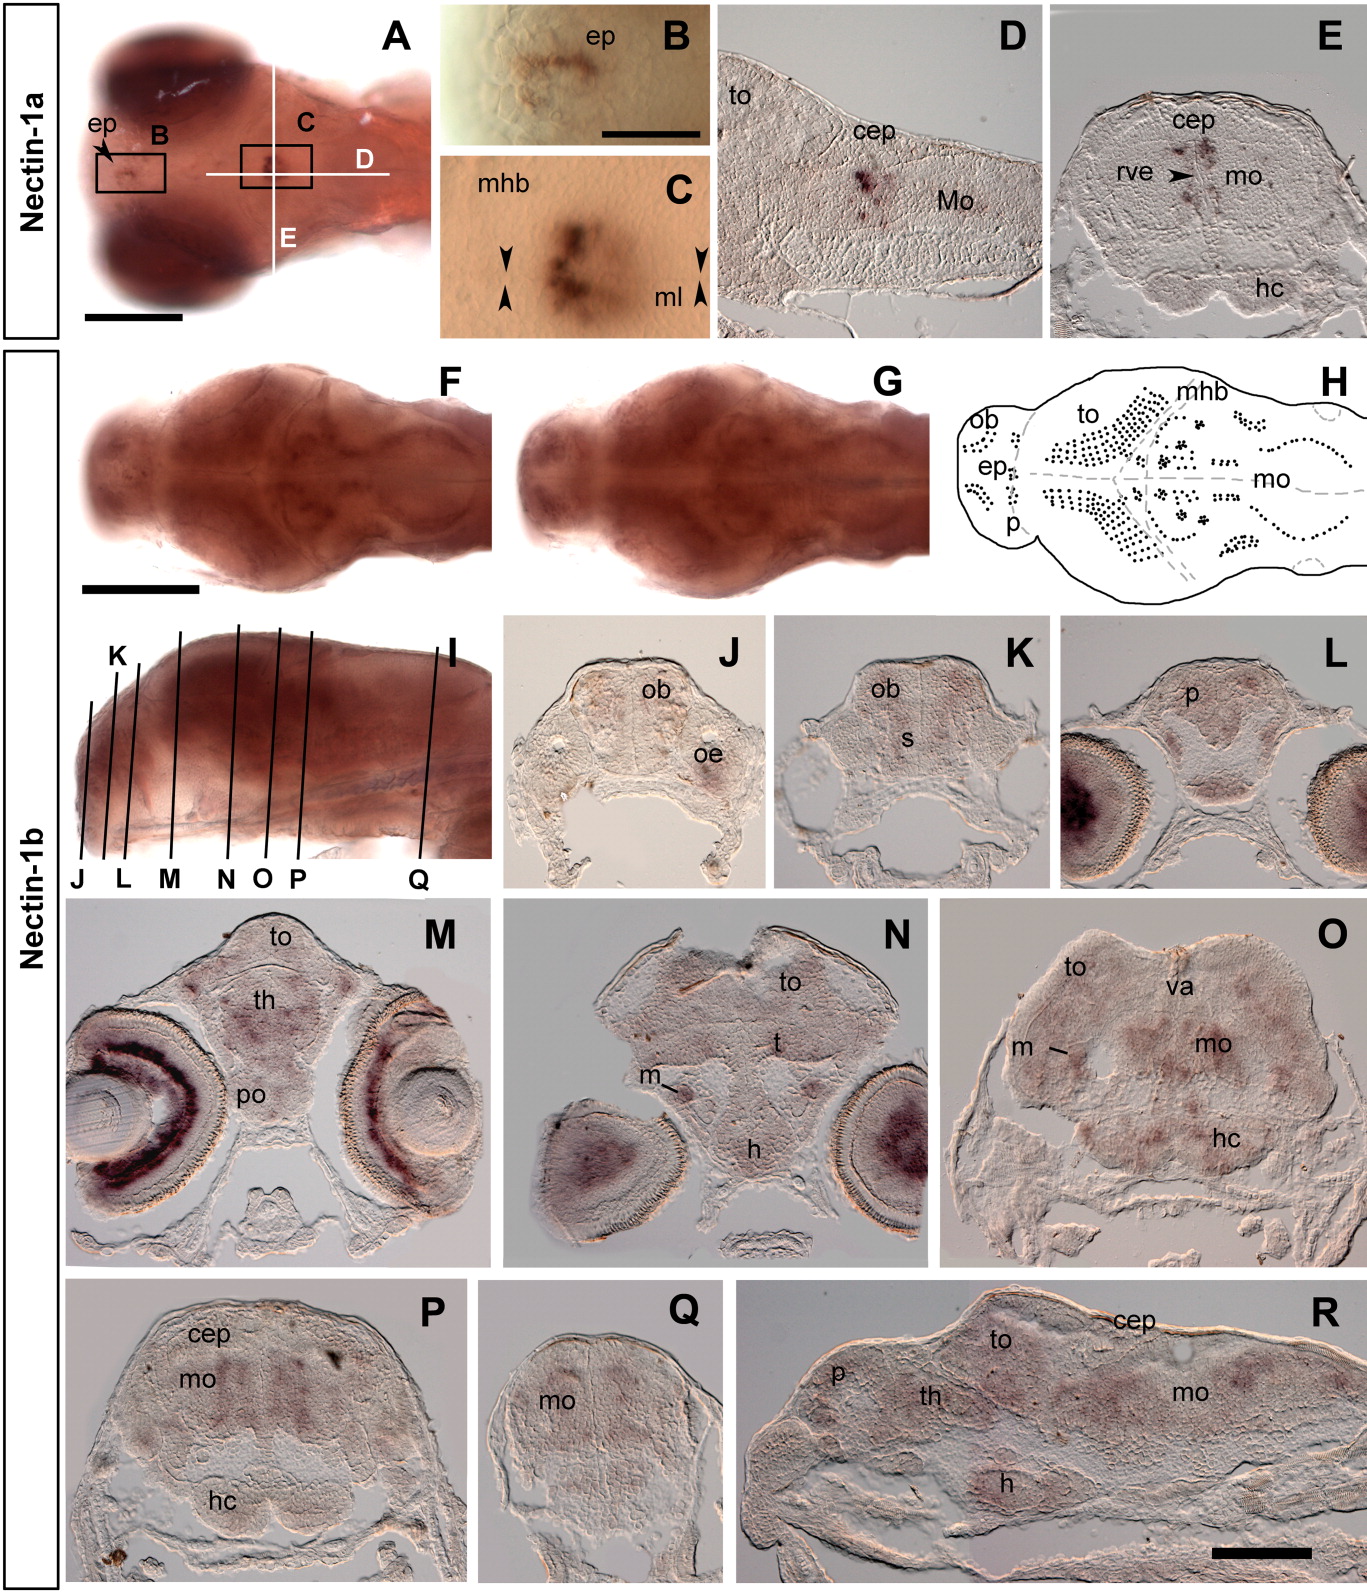
Fig. 7 Expression of nectin-1a and nectin1-b in cryosections of zebrafish brain at 120 hpf. Whole mounts are shown in dorsal (A, F, G) or lateral views (I). The eyes were removed in E, G, and I. B, C: Enlargements of the similarly labelled boxed areas in A. Cryosections in D and E are at the positions of the white lines in A. The focus planes in F and G are different, and a composite drawing of the staining is shown in H. I shows the position of the cryosections presented in J-Q. R: A sagittal cryosection. The genes are indicated. Abbreviations are: cep, cerebellar plate; ep, epiphysis; h, hypothalamus; hc, caudal hypothalamus; m, migrated posterior tubercular area; mhb, midbrain-hindbrain boundary; mo, medulla oblongata; ob, olfactory bulb; oe, olfactory epithelium; p, pallium; po, preoptic region; rve, rombecephalic ventricle; s, subpallium; t, tegmentum; th, thalamus; to, tectum opticum; va, valvula cerebelli. Scale bars = 50 μm (B and C), 100 μm (D,E, J-R), and 200 μm (A and F-I).