
- Title
-
Both 5' and 3' flanks regulate zebrafish brain-derived neurotrophic factor gene expression
- Authors
- Heinrich, G., and Pagtakhan, C.J.
- Source
- Full text @ BMC Neurosci.
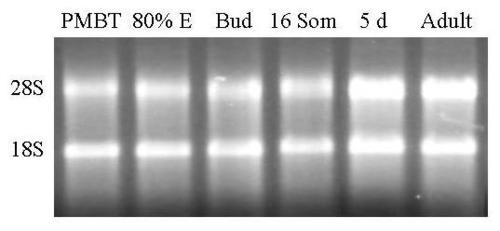
Agarose Gel Electrophoresis of total RNA from embryos, larvae and adult Zebrafish. Total RNA was extracted as described in methods and subjected to electrophoresis through a native 1% agarose gel. The amplification products were stained with ethidium bromide and photographed under UV light using a digital camera. PMBT = pre-midblastula transition. 80% E = 80% epiboly. 16 Som = 16 somite stage. 5d = 5 days post-dertilization. The two major ribosomal RNA bands are marked in the left hand margin. |
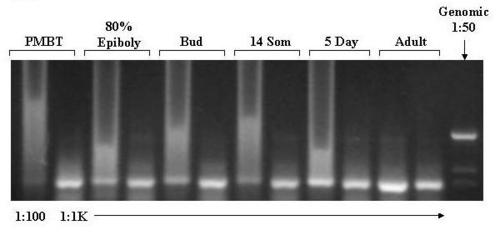
Agarose Gel Electrophoresis of products of amplification of cDNA with β-Actin primers. cDNA was prepared from aliquots of total RNA samples extracted from embryos, larvae and adult zebrafish as described in methods. Aliquots of the cDNA were diluted 1:100 and 1:1000 prior to amplification with β-actin specific primers. The actin primers span three introns. Genomic zebrafish DNA, diluted 1:50 to approximately 100 ng/μl, was also amplified to confirm that the amplification products are derived from cDNA. The primer sequences are provided in the method section. The amplification products were subjected to electrophoresis through a 1.2% agarose gel, stained with ethidium bromide, and photographed under UV light using a digital camera. PMBT = pre-midblastula transition. 16 Som = 16 somite stage. 5d = 5 days post-dertilization. The dilution factors are indicated at the bottom of the panel. The large amount of amplification product in the 1:100 samples led to smearing and "rabbit-earing". |
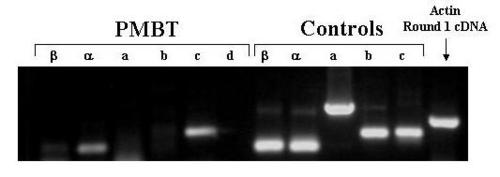
Agarose Gel Electrophoresis of products of amplification of PreMBT cDNA with exon-specific primers. cDNA was prepared from total RNA extracted from pre-MBT embryos. Aliquots of the cDNA samples were ampified in 2 rounds of PCR with the indicated exon-specific nested primers and with β-actin specific primers. Aliquots of 5′RACE clone plasmid DNA were also amplified. The amplification products were subjected to electrophoresis through a 1.5% agarose gel, stained with ethidium bromide, and photographed under UV light using a digital camera. PMBT = pre-midblastula transition. |
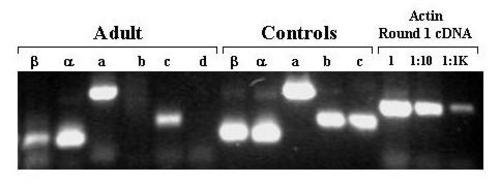
Agarose Gel Electrophoresis of products of amplification of PreMBT cDNA with exon-specific primers. cDNA was prepared from total RNA extracted from adult zebrafish. Aliquots of the cDNA were amplified in 2 rounds of PCR with the indicated exon-specific nested primers and with β-actin specific primers. The cDNA was diluted as indicated prior to amplification with the β-actin primers. Aliquots of 5′RACE clone plasmid DNA corresponding to each exon (except exon 1d for which c241 served as template) were also amplified. The amplification products were subjected to electrophoresis through a 1.5% agarose gel, stained with ethidium bromide, and photographed under UV light using a digital camera. EXPRESSION / LABELING:
|
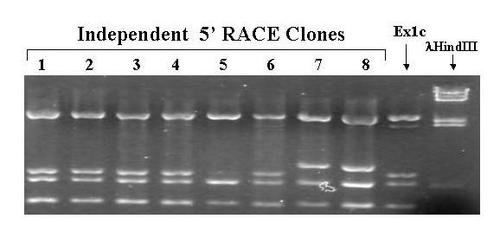
PvuII Restriction Enzyme Digests of 5'RACE Clones From Pre-MBT Embryos. 5' RACE was performed using total RNA extracted from pre-midblastula transition embryos as described in methods. DNA extracted from individual clones was digested with PvuII. A previously identified 5' RACE clone from 10 days old larvae was also digested as a control. Phage λ DNA digested with HindIII was used as a size marker. The digests were subjected to electrophoresis through a 1.5% agarose gel, stained with ethidium bromide, and photographed under UV light using a digital camera. |
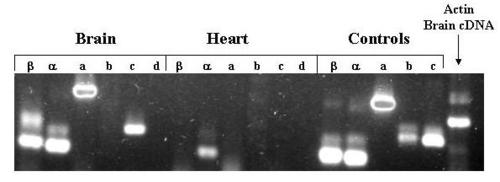
Agarose Gel Electrophoresis of products of amplification of adult organ cDNA with exon-specific primers. Total RNA was extracted from pooled adult zebrafish brains and hearts as described in methods. Aliquots of the RNA were converted to cDNA and then amplified with the indicated exon-specific and β-actin primers. Aliquots of 5′RACE clone plasmid DNA corresponding to each exon (except exon 1d for which c241 served as template) were also amplified. The amplification products were subjected to electrophoresis through a 1.5% agarose gel, stained with ethidium bromide, and photographed under UV light using a digital camera. |

Expression of Dex1d in large hindbrain neuron. Embryos were injected with the Dex1d construct as described in methods. Two days later expression of the reporter was visualized in live embryos using a fluorescent microscope. Expressing embryos were photographed using a digital camera. A single whole embryo is shown in panel A. The expressing neuronal cell body is marked with an arrow with a head. The end of the axon projecting down the spinal cord is marked with a straight arrow. Mag = 2×. Panel B shows an enlargement of the axon. Mag = 10×. |
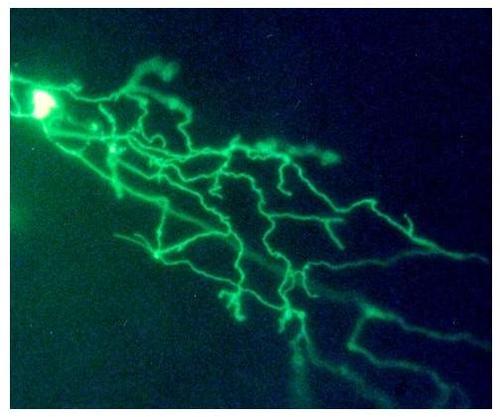
Expression of HCS-MiEx in Rohon-Beard neuron. Embryos were injected with the HCS-MiEx construct as described in methods. Two days later expression of the reporter was visualized in live embryos using a fluorescent microscope. Expressing embryos were photographed using a digital camera. The image shows a Rohon-Beard neuron. The cell body is overexposed to show the widely ramifying peripheral axon. Mag = 30×. |
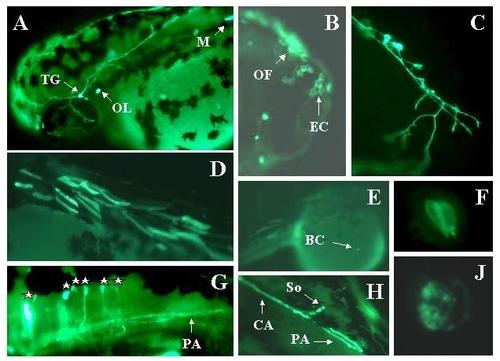
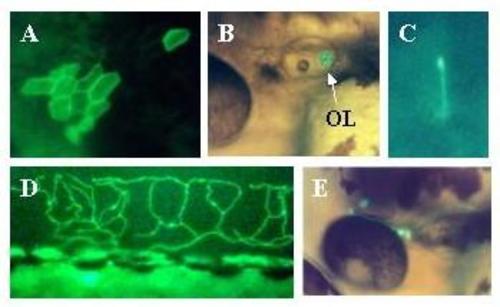
Expression of Adam in live embryos. Embryos were injected with the Adam construct as described in methods. Two days later expression of the reporter was visualized in live embryos using a fluorescent microscope. Expressing embryos were photographed using a digital camera. Panel A: TG = trigeminal. OL = otolith. M = skeletal muscle. Mag = 2×. Panel B: OL = olfactory epithelial cell. EC = epithelial cells. Mag = 30×. Panel C: Rohon-Beard neuron. Mag = 30×. Panel D: skeletal muscle cells. Mag = 2×. Panel E: BC = blood cell temporarily arrested over yolk. Mag = 2×. Panel F: Hair cells in the ear. Note pear-like shape with hair pointing toward lumen of otic capsule (bottom of panel). Mag = 60×. Panel G: Hindbrain neurons. Each cell body is marked with a star. The forebrain is to the left. The most rostral cell body is overexposed. PA = peripheral axon projecting down the spinal cord. Mag = 30×. Panel H: hindbrain neuron with central (CA) and peripheral (PA) axons. Mag = 30×. Panel J: Otolith close-up. Mag = 60×. |
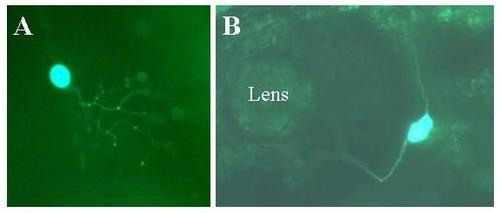
Expression of Adam in live embryos. Embryos were injected with the Adam construct as described in methods. Two days later expression of the reporter was visualized in live embryos using a fluorescent microscope. Expressing embryos were photographed using a digital camera. Panel A: Epithelial cells. Mag = 10×. Panel B: Otolith. Mag = 10×. Panel C: Motor neuron. Mag = 30×. Panel D: Rohon-Beard neuron arborizing among epithelial cells of dorsal fin. Mag = 10×. Panel E: TG = Trigeminal neuron. Mag = 10×. |
Expression of NIn1c-GFP in live embryos. Embryos were injected with the Nin1c-GFP construct as described in methods. Two days later expression of the reporter was visualized in live embryos using a fluorescent microscope. Expressing embryos were photographed using a digital camera. Panel A: Rohon-Beard neuron. Note that the axons are only weakly fluorescent with the GFP reporter compared with the EGFP-F reporter (for example figures 10 and 11). Mag = 30×. Panel B: Trigeminal neuron. Mag = 30×. |

Unillustrated author statements EXPRESSION / LABELING:
|