
FIGURE
Fig. 14
Fig. 14
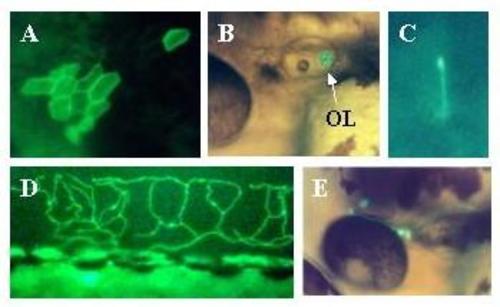
Expression of Adam in live embryos. Embryos were injected with the Adam construct as described in methods. Two days later expression of the reporter was visualized in live embryos using a fluorescent microscope. Expressing embryos were photographed using a digital camera. Panel A: Epithelial cells. Mag = 10×. Panel B: Otolith. Mag = 10×. Panel C: Motor neuron. Mag = 30×. Panel D: Rohon-Beard neuron arborizing among epithelial cells of dorsal fin. Mag = 10×. Panel E: TG = Trigeminal neuron. Mag = 10×. |
Expression Data
Expression Detail
Antibody Labeling
Phenotype Data
Phenotype Detail
Acknowledgments
This image is the copyrighted work of the attributed author or publisher, and
ZFIN has permission only to display this image to its users.
Additional permissions should be obtained from the applicable author or publisher of the image.
Full text @ BMC Neurosci.