
|
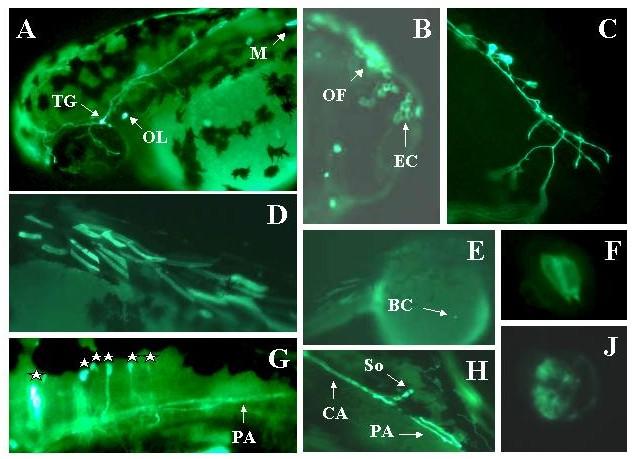
Fig. 13 Expression of Adam in live embryos. Embryos were injected with the Adam construct as described in methods. Two days later expression of the reporter was visualized in live embryos using a fluorescent microscope. Expressing embryos were photographed using a digital camera. Panel A: TG = trigeminal. OL = otolith. M = skeletal muscle. Mag = 2×. Panel B: OL = olfactory epithelial cell. EC = epithelial cells. Mag = 30×. Panel C: Rohon-Beard neuron. Mag = 30×. Panel D: skeletal muscle cells. Mag = 2×. Panel E: BC = blood cell temporarily arrested over yolk. Mag = 2×. Panel F: Hair cells in the ear. Note pear-like shape with hair pointing toward lumen of otic capsule (bottom of panel). Mag = 60×. Panel G: Hindbrain neurons. Each cell body is marked with a star. The forebrain is to the left. The most rostral cell body is overexposed. PA = peripheral axon projecting down the spinal cord. Mag = 30×. Panel H: hindbrain neuron with central (CA) and peripheral (PA) axons. Mag = 30×. Panel J: Otolith close-up. Mag = 60×.