
- Title
-
In vitro evolution of myc-tag antibodies: in-depth specificity and affinity analysis of Myc1-9E10 and Hyper-Myc
- Authors
- Russo, G., Unkauf, T., Meier, D., Wenzel, E.V., Langreder, N., Schneider, K.T., Wiesner, R., Bischoff, R., Stadler, V., Dübel, S.
- Source
- Full text @ Biol. Chem.
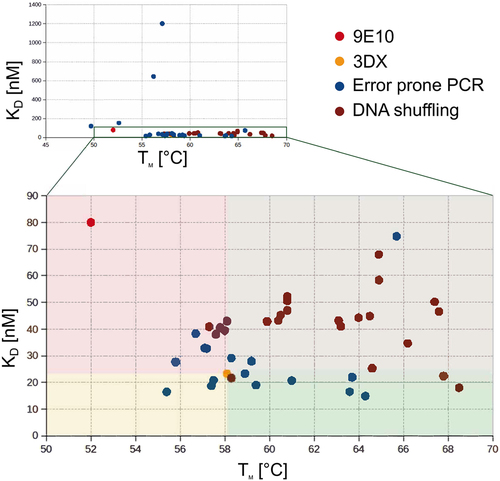
Scatter-plot of affinity versus thermal stability for each of the generated antibodies. The four colored gates help visualizing the antibody clone properties in comparison to 3DX (orange dot). The green gate shows clones with both better thermal stability and higher affinity. TUN219-2C1 (Hyper-Myc). |
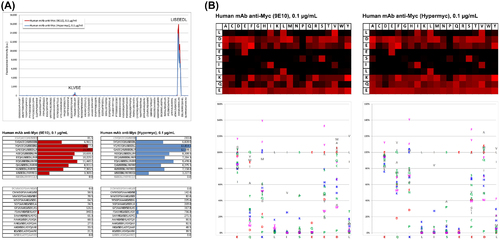
Epitope mapping studies on peptide array. (A) Hyper-Myc and Myc1-9E10 monoclonal antibodies minimal epitope recognition as determined by PEPperMAP® Epitope Mapping laser printed peptide arrays. Bottom: raw data, top: corresponding intensity plot. Both antibodies showed a primary response towards the consensus motif LISEEDL and a very weak secondary response against the consensus motif KLVSE. (B) PEPperMAP® Epitope Substitution Scans of epitope peptide 1EQKLISEEDL10 arrays stained with Myc1-9E10 (left) or Hyper-Myc (right). Top: heat maps corresponding to microarray scan results. Increasing red intensity levels indicate the likelihood that a certain amino acidic substitution is not disrupting the binding, so black indicates substitutions that are not tolerated. Bottom: Position dependent replacement quantification. Binding intensities per each substitution of Myc1-9E10 (left) or Hyper-Myc (right) were normalized to the intensity level obtained with the wild type peptide 1EQKLISEEDL10. |
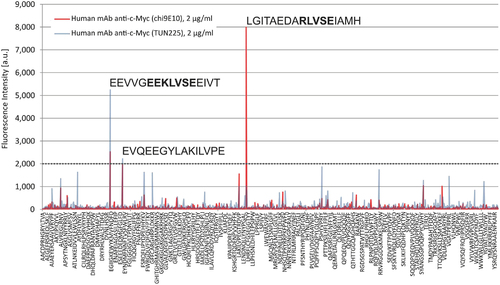
Cross reactivity profiling. Myc1-9E10 (red) or Hyper-Myc (blue) top 1299 peptide hits on PEPperCHIP® Human Epitome Microarray (29,127 human peptides). A fluorescence signal of 2000 is considered in the range of 10% of the signal generated by antibody incubation on myc-epitope peptide. Myc1-9E10 as well as Hyper-Myc were applied at 2 μg/mL. |
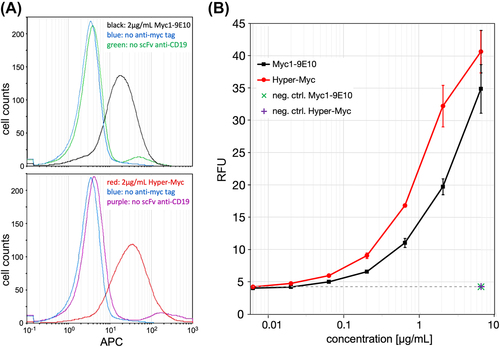
Flow cytometry analysis of myc-tagged antibodies bound to cells. (A) Histograms of Daudi cells stained with either Myc1-9E10 (top panel) or Hyper-Myc (bottom panel) in the presence or absence of primary anti-CD19 scFv myc-tagged antibody fragment. Histograms are shown for concentrations of 2 μg/mL of Myc1-9E10 or Hyper-Myc, or 6.32 μg/mL for the negative controls. (B) Sensitivity of detection of myc-tagged anti-CD19 scFv on Daudi cells followed by incubation with either Hyper-Myc (red) or Myc1-9E10 (black) in concentrations ranging from 6.32 ng/mL to 6.32μg/mL. Alive single cells were gated; APC-conjugated goat anti-mouse IgG Fc was used for visualisation, and the median of the APC signal was measured using a MACSQuant flow cytometer. Error bars represent the standard deviation of duplicates. |

Whole mount immunofluorescence analysis of 2dpf mScarlet-myc positive transgenic zebrafish using Hyper-Myc (top), Myc1-9E10 (middle), or secondary antibody control (bottom). The myc-epitope is expressed as C-terminal fusion tag at the red fluorescent reporter mScarlet. |
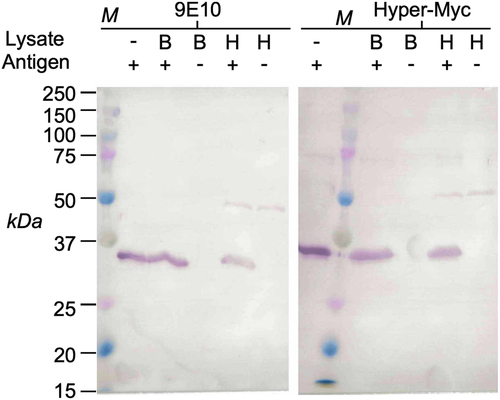
Immunoblots of cell lysates containing 100 ng per lane of a myc-tagged scFv fragment. B, E.coli total cell lysate, H, human cells (Expi293F cell line), M, marker. |

Quantitative immunodetection of myc-peptide labelled antigen with mouse IgG Hyper-Myc or Myc1-9E10 using the automated Protein Simple™ Western Immunoassay system. Electropherograms represent quantitative chemiluminescence signal per each tested antibody concentration. Bottom: automatically generated gel-like data illustration. |

Antibody stability assessment. (A) Size exclusion chromatography (SEC) analysis of different Hyper-Myc IgG variants with constant parts of human IgG1 (left panel), rabbit IgG (middle panel) or mouse IgG2a (right panel). (B) Shelf-life of Myc1-9E10 hybridoma antibody was compared to the three different versions of Hyper-Myc. Each antibody was stored for a period of seven months at 4 °C prior testing in triplicate in ELISA. An aliquot stored at −80 °C for the same period of time was freshly thawed and used as reference. The aliquots did not contain any protectants nor stabilizers. Error bars represent the standard deviation. Asymmetric Sigmoidal, five parameter logistic (5 PL) curve fitting was used to determine the EC50 values. |