
Fig. 2
- ID
- ZDB-FIG-220727-50
- Publication
- Russo et al., 2022 - In vitro evolution of myc-tag antibodies: in-depth specificity and affinity analysis of Myc1-9E10 and Hyper-Myc
- Other Figures
- All Figure Page
- Back to All Figure Page
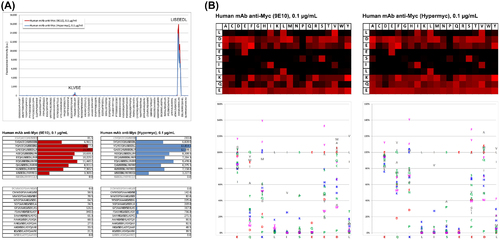
Epitope mapping studies on peptide array. (A) Hyper-Myc and Myc1-9E10 monoclonal antibodies minimal epitope recognition as determined by PEPperMAP® Epitope Mapping laser printed peptide arrays. Bottom: raw data, top: corresponding intensity plot. Both antibodies showed a primary response towards the consensus motif LISEEDL and a very weak secondary response against the consensus motif KLVSE. (B) PEPperMAP® Epitope Substitution Scans of epitope peptide 1EQKLISEEDL10 arrays stained with Myc1-9E10 (left) or Hyper-Myc (right). Top: heat maps corresponding to microarray scan results. Increasing red intensity levels indicate the likelihood that a certain amino acidic substitution is not disrupting the binding, so black indicates substitutions that are not tolerated. Bottom: Position dependent replacement quantification. Binding intensities per each substitution of Myc1-9E10 (left) or Hyper-Myc (right) were normalized to the intensity level obtained with the wild type peptide 1EQKLISEEDL10. |