
|
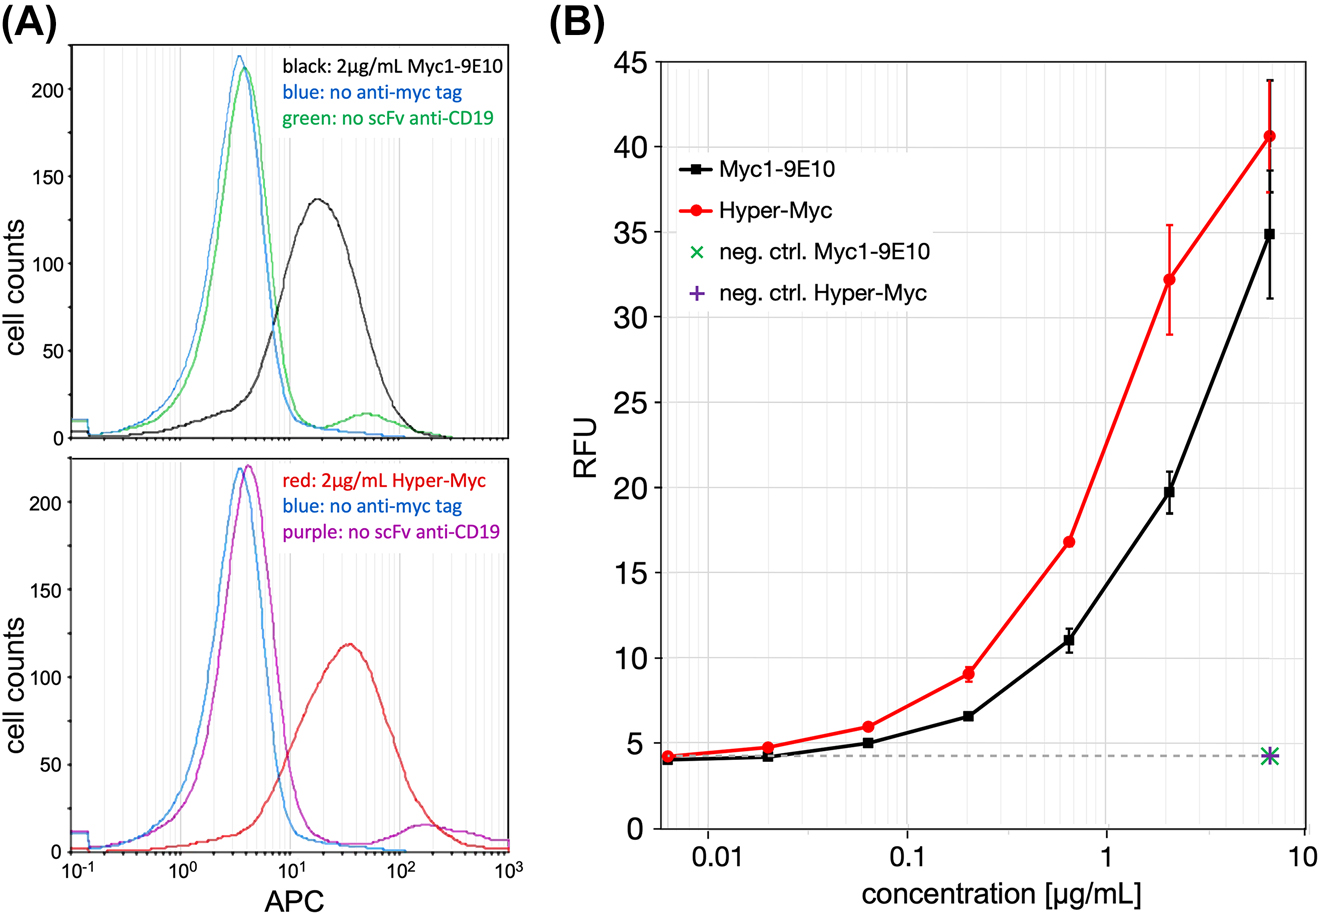
Fig. 4
Flow cytometry analysis of myc-tagged antibodies bound to cells. (A) Histograms of Daudi cells stained with either Myc1-9E10 (top panel) or Hyper-Myc (bottom panel) in the presence or absence of primary anti-CD19 scFv myc-tagged antibody fragment. Histograms are shown for concentrations of 2 μg/mL of Myc1-9E10 or Hyper-Myc, or 6.32 μg/mL for the negative controls. (B) Sensitivity of detection of myc-tagged anti-CD19 scFv on Daudi cells followed by incubation with either Hyper-Myc (red) or Myc1-9E10 (black) in concentrations ranging from 6.32 ng/mL to 6.32μg/mL. Alive single cells were gated; APC-conjugated goat anti-mouse IgG Fc was used for visualisation, and the median of the APC signal was measured using a MACSQuant flow cytometer. Error bars represent the standard deviation of duplicates.