
FIGURE
Fig. 1
- ID
- ZDB-FIG-220727-49
- Publication
- Russo et al., 2022 - In vitro evolution of myc-tag antibodies: in-depth specificity and affinity analysis of Myc1-9E10 and Hyper-Myc
- Other Figures
- All Figure Page
- Back to All Figure Page
Fig. 1
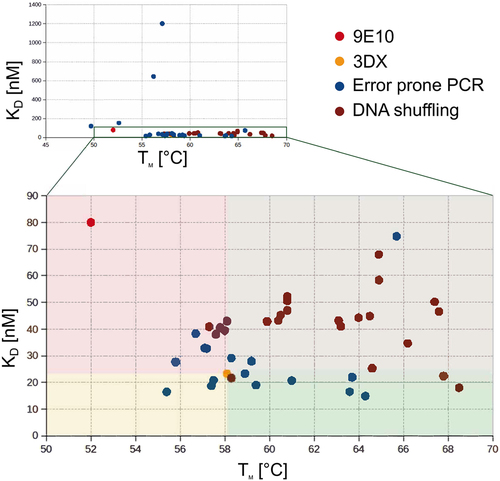
Scatter-plot of affinity versus thermal stability for each of the generated antibodies. The four colored gates help visualizing the antibody clone properties in comparison to 3DX (orange dot). The green gate shows clones with both better thermal stability and higher affinity. TUN219-2C1 (Hyper-Myc). |
Expression Data
Expression Detail
Antibody Labeling
Phenotype Data
Phenotype Detail
Acknowledgments
This image is the copyrighted work of the attributed author or publisher, and
ZFIN has permission only to display this image to its users.
Additional permissions should be obtained from the applicable author or publisher of the image.
Full text @ Biol. Chem.