- Title
-
Characterization of genetically targeted neuron types in the zebrafish optic tectum
- Authors
- Robles, E., Smith, S.J., and Baier, H.
- Source
- Full text @ Front. Neural Circuits
|
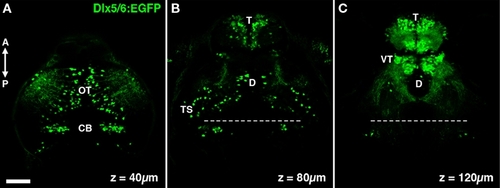
The dlx5/6:GFP transgene labels specific neuronal populations in the larval zebrafish brain. (A) A single confocal section acquired 40 μm below the dorsal surface of the brain. GFP transgene expression is observed in cells in the optic tectum (OT) and cerebellum (CB). (B) At a depth of 80 μm dense GFP labeling of cells is seen in the olfactory bulb of the telencephalon (T), in addition to sparse labeling throughout the diencephalon (D) and mesencephalic structures such as the torus semicircularis (TS). (C) At a depth of 120 μm labeling is largely restricted to the telencephalon and the ventral thalamus (VT). Dashed line indicates midbrain–hindbrain boundary. Scale bar, 50 μm. |
|
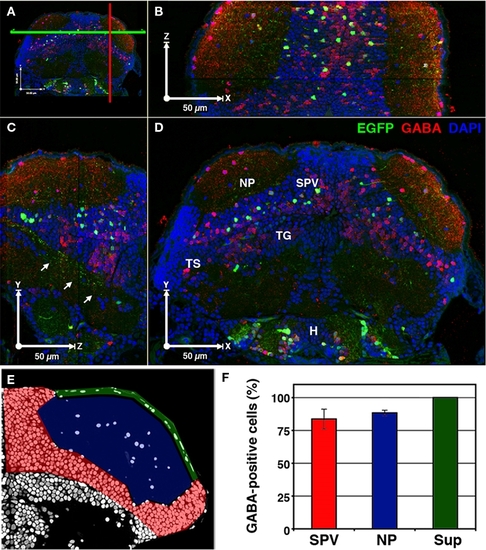
A majority of cells labeled in dlx5/6:GFP larvae are GABAergic. 3D reconstruction of a 5-dpf dlx5/6:GFP larvae that was fixed and sectioned at a thickness of 1 μm and labeled by GABA immunofluorescence and DAPI nuclear staining. (A) Colored lines indicate the relative locations of the cut-views presented in (B–D). (B) Cut-view in the XZ plane (dorsal view). (C) Cut-view in the YZ plane (sagittal). (D) Cut-view in the XY plane (coronal). Note the single-cell resolution in 3D and the high density of GABAergic cells in the periventricular cell layer (SPV) and neuropil (NP) regions of the tectum and the relative sparsity of GFP-labeled neurons. Arrows in (C) indicate axonal tracts of diencephalic and mesencephalic origins en route to the hindbrain. (E) A single section labeled with DAPI. Colored shading indicates the tectal regions defined for GABA phenotypic analysis: SPV (red), neuropil (blue), and superficial neuropil (green). (F) GABAergic phenotypic analysis in the optic tectum of 5 dpf dlx5/6:GFP larvae. Tegmentum (TG), hypothalamus (H), torus semicircularis (TS). Scale bar, 50 μm in (B–E). |
|
The dlx5/6:GFP transgene labels a subpopulation of glutamatergic neurons. (A) Confocal image of vglut2b fluorescence in situ hybridization in a 5-dpf dlx5/6:GFP larvae. (B) 2× magnification of regions indicated by boxes in (A). Merged images of GFP immuofluorescence and vglut2b in situ labeling (left) and vglut2b in situ labeling alone (right). GFP fluorescence was used to trace cell body outlines. Note strong, punctate vglut2b in situ signal in the perinuclear region of cell body in B2. In contrast, the majority of cells in the SPV (B1) and all cells in the superficial NP (B3) lacked this punctate vglut2b mRNA signal. (C) Quantification of glutamatergic phenotypic analysis in dlx5/6:GFP. Scale bar, 20 μm in (A), 10 μm in (B). |
|
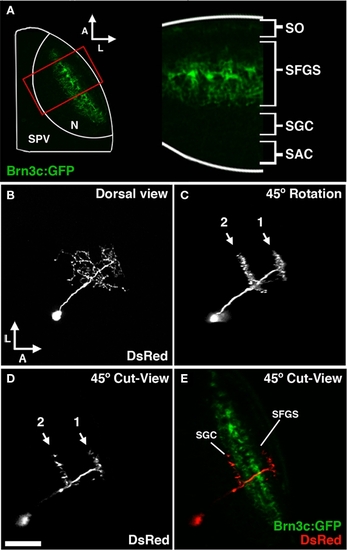
Morphological analysis of neurons labeled by dg4ii plasmid. (A) Approach used to determine laminar targeting of neurites in the tectal neuropil. Image of pou4f3:gfp fluorescence, which labels a subset of RGC axons that target the SO and the two deepest sublayers of the SFGS. This signal was used to determine the relative thickness of the SO and SFGS layers, which receive the vast majority of retinal afferents. (B) Maximum projection of a confocal image volume obtained from a single tectal neuron at 5 dpf labeled by blastomere injection of dg4ii and uas:dsred plasmids. Note the single apical neurite that gives rise to a compact arbor lacking an efferent projection. (C) Forty-five degree rotation of 3D volume rendering performed on image stack in B reveals precise stratification of two distinct arbors. (D) Cut-view at the same 45° orientation as in (C) demonstrates the roughly 45° orientation of the apical dendrite. (E) A merged image of cut-view in (D; red) and pou4f3:gfp fluorescence (green) reveals that the superficial arbor targets the SFGS layer, whereas the deeper arbor targets the SGC layer below the SFGS. Scale bar, 50 μm in (A), 25 μm in (B–E). |
|
The bistratified periventricular interneuron cell type. (A) Merged confocal image volume of a single 4 dpf bsPVIN expressing both dsRed (red) and Syp–GFP (green). (B) 2× magnification of bracketed region in (A). (C) Syp–GFP fluorescence of region in (D). Note the bright Syp–GFP puncta located within the arbor that targets the deeper synaptic layer (arrows in D), whereas puncta are absent from the more superficial arbor (arrowheads in C). (D) Schematic depiction of bsPVIN cell body distribution throughout the SPV layer. Cell traced in red indicates the relative location and scale of neuron depicted in (C). Scale bar, 20 μm in (A), 10 μm in (B,C). |
|
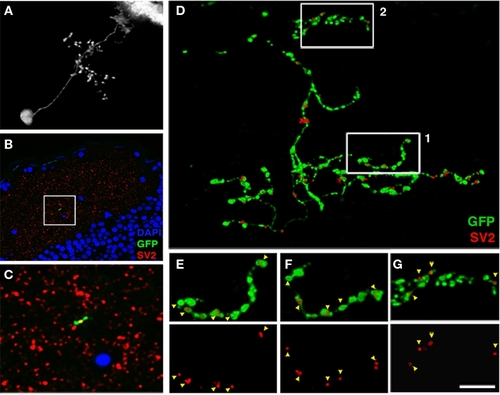
Array tomographic visualization of bsPVIN presynaptic specializations. (A) Individual bsPVIN imaged immediately prior to fixation and processing for array tomographic analysis. (B) Section array was stained with an anti-SV2 antibody (red) and DAPI (blue) to label nuclei. (C) 5× magnification of boxed region in (B) containing a segment of the SGC targeted axonal arbor of bsPVIN shown in A. Note SV2 puncta contained within segment of GFP-labeled varicosity within this single 200 nm section. (D) 3D rendering of the section array containing the GFP-labeled neuron in (A–C). Only SV2 puncta that colocalized with areas of GFP labeling were included in rendering. Note large varicosities on the deeper SGC arbor and thin inter-varicosity neurites not detectable by laser-scanning microscopy in (A). (E) 1.75× magnification of boxed region 1 in (D). (F) Forty-five degree rotation of region in (E). Note that a majority of axonal varicosities contain distinct SV2 puncta. (G) 1.75× magnification of boxed region 2 in (D). Note that the majority of SV2 puncta are not entirely within GFP-labeled dendrite. Scale bar, 20 μm in (A), 40 μm in (B), 8 μm in (C), 3.5 μm in (D), 2 μm in (E–G). |
|
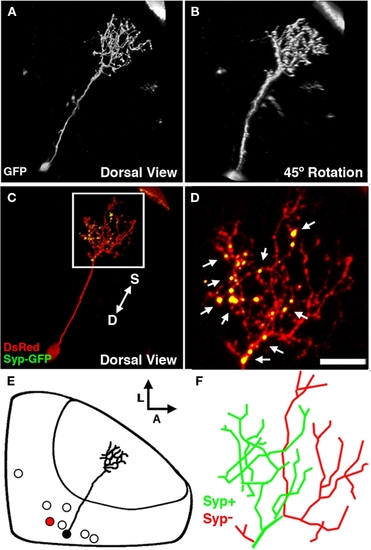
The non-stratified periventricular interneuron cell type. (A) Dorsal view of a two-photon image volume containing a single labeled nsPVIN imaged at 5 dpf. Note the long apical neurite extended into the neuropil. (B) Forty-five degree rotation of image volume in (A). Note the absence of any stratification within the arbor. (C) Merged confocal image volume of a single 4 dpf nsPVIN expressing both dsRed (red) and Syp–GFP (green). Arrow depicts orientation of neuropil layers from superficial (S) to deep (D). (D) 2.5× magnification of boxed region in (C). Note the bright Syp–GFP puncta contained within a subset of neurite branches (arrows). (E) Schematic depiction of nsPVIN cell body distribution throughout the SPV layer. Cell traced in black corresponds to neuron in (A) and (B). Note the deep SPV location of cell body. (F) Manual tracing of the neurite arbor in (D). Green lines indicate branches containing Syp–GFP puncta, whereas branches devoid of Syp–GFP labeling are in red. Scale bar, 20 μm in (A–C), 8 μm in (D,F). |
|
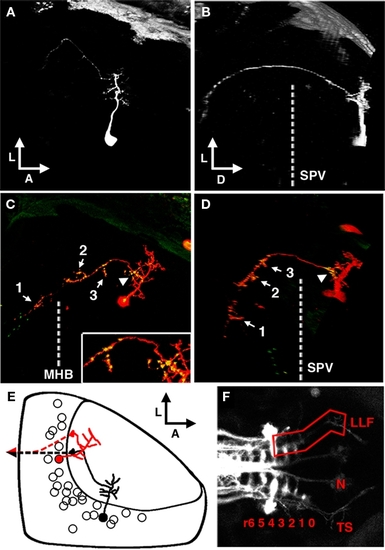
The periventricular projection neuron cell type. (A) Dorsal view of a two-photon image volume containing a single labeled PVPN imaged at 3 dpf. Note the short, sparse apical dendrite that gives rise to a single neurite that extends laterally toward the edge of the tectum. (B) Ninety degree rotation of image volume in (A). The single long process has extended ventrally out of the tectum before redirecting to extend in a postero-medial orientation. Dashed line indicates the approximate ventral extent of the SPV. (C) Merged confocal image volume of a single 5 dpf nsPVIN expressing both dsRed (red) and Syp–GFP (green). Dashed line indicates approximate location of the midbrain–hindbrain boundary. Inset: 2× magnification of region indicated by arrowhead. Note that bright Syp–GFP puncta are located in multiple regions: within the distal segment of the efferent process (arrow 1), the sparse network of collateral branches in the ventral midbrain (arrows 2–3), and a proximal segment within the tectal neuropil (arrowhead). (D) Ninety degree rotation of image volume in (C). (E) Schematic depiction of PVPN cell body distribution throughout the SPV layer. Note that a majority of these cells are located in the shallow SPV close to the neuropil. Cell traced in black correspond to neuron in (A,B). Note that the more medial cell body location necessitates an initial lateral trajectory in order to reach the edge of the tectal neuropil. In contrast, the cell in (C,D; traced in red) is located laterally, which permits a more direct exit from the tectal neuropil. Dashed line indicates descending axon trajectory after exiting the tectum. (F) Maximum projection of reticulospinal circuitry labeled by pressure injection of DiI into the spinal cord of a fixed larvae at 5 dpf. Boxed region indicates the synaptic field for PVPN efferent axons, which grow along the trajectory of the LLF, which runs from the torus TS, through the MO to the HB reticular formation (numbers indicate rhombomere position). Boxed region indicates the typical PVPN arborization field, which spans the TS, MO, and anterior hindbrain. Dashed line indicates midbrain–hindbrain boundary (MHB). Scale bar, 25 μm in (A–D), 100 μm in (E). |
|
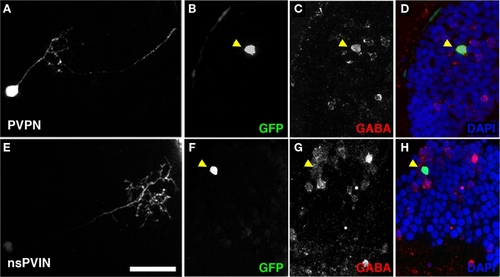
Non-stratified periventricular interneurons and PVPN cell types are GABAergic. (A) Maximum Projection of a single PVPN at 5 dpf. (B,C) Single array section containing cell body of neuron in (A) labeled by GFP fluorescence in (B), anti-GABA immunofluorescence in (C). (D) Merged image of (B,C) with DAPI nuclear labeling (blue). (E) Maximum Projection of a single nsPVIN at 5 dpf. (F,G) Single array section containing cell body of neuron in (E) labeled by GFP fluorescence in (F), anti-GABA immunofluorescence in (G). (H) Merged image of (F,G) with DAPI nuclear labeling (blue). Note preservation of GFP signal and colocalization of GABA immunoreactivity (arrowheads in D,H). Scale bar, 20 μm. |

