
|
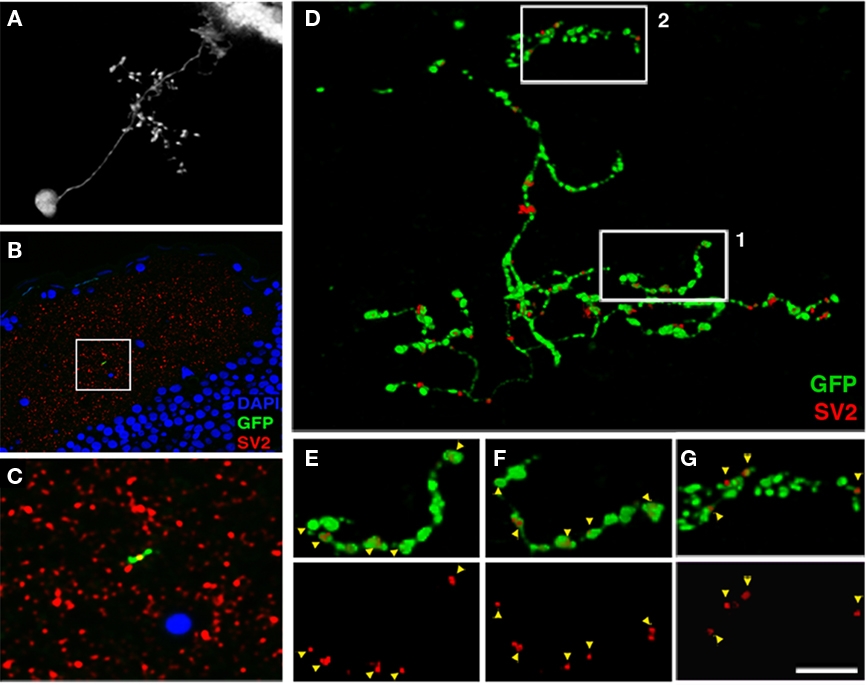
Fig. 6
Array tomographic visualization of bsPVIN presynaptic specializations. (A) Individual bsPVIN imaged immediately prior to fixation and processing for array tomographic analysis. (B) Section array was stained with an anti-SV2 antibody (red) and DAPI (blue) to label nuclei. (C) 5× magnification of boxed region in (B) containing a segment of the SGC targeted axonal arbor of bsPVIN shown in A. Note SV2 puncta contained within segment of GFP-labeled varicosity within this single 200 nm section. (D) 3D rendering of the section array containing the GFP-labeled neuron in (A–C). Only SV2 puncta that colocalized with areas of GFP labeling were included in rendering. Note large varicosities on the deeper SGC arbor and thin inter-varicosity neurites not detectable by laser-scanning microscopy in (A). (E) 1.75× magnification of boxed region 1 in (D). (F) Forty-five degree rotation of region in (E). Note that a majority of axonal varicosities contain distinct SV2 puncta. (G) 1.75× magnification of boxed region 2 in (D). Note that the majority of SV2 puncta are not entirely within GFP-labeled dendrite. Scale bar, 20 μm in (A), 40 μm in (B), 8 μm in (C), 3.5 μm in (D), 2 μm in (E–G).