
- Title
-
Zebrafish deficient for Muscleblind-like 2 exhibit features of myotonic dystrophy
- Authors
- Machuca-Tzili, L.E., Buxton, S., Thorpe, A., Timson, C.M., Wigmore, P., Luther, P.K., and Brook, J.D.
- Source
- Full text @ Dis. Model. Mech.
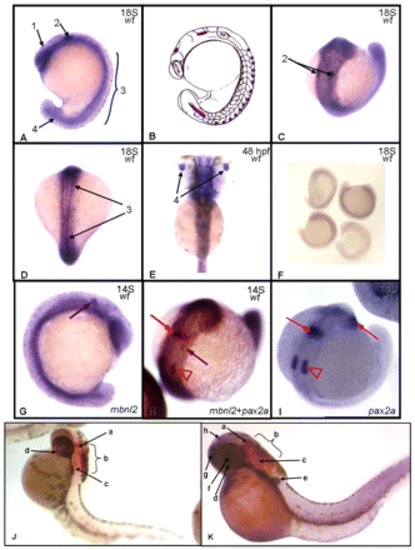
Expression pattern of mbnl2 in zebrafish. During the segmentation period (A–D), the embryos display an mbnl2-positive signal in mesencephalon (1), at hindbrain level (2), in spinal cord neurons (3) and in neural tube (4). Panel B shows a schematic representation of the embryo in panel A, with the mbnl2 signal symbolized in purple. (E) At 48 hpf, during the hatching period zebrafish mbnl2 is also expressed in the lens (4). (F) The sense control probe allows us to differentiate between background and the true signal. (G) Single detection hybridization (pax2a + mbnl2) and (I) single detection of pax2a transcripts in wild-type zebrafish at 14 somites. Red arrows signal the position of pax2a-positive cells at the midbrain-hindbrain boundary and immature eye; red arrowheads show the position of the otic vesicles; purple arrows signal mbnl2-expressing cells. (J) At 48 hpf, pax2a is expressed in the midbrain-hindbrain boundary (a), hindbrain (b), otic capsule (c) and optic nerve (d). (K) During the same stage, mbnl2 is expressed in the pectoral fin bud (e), lens (f), telencephalon (g) and epiphysis (h). The two signals do not overlap. EXPRESSION / LABELING:
|
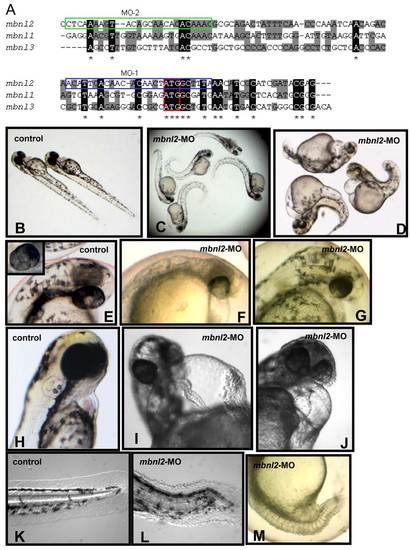
The severity of the phenotype of mbnl2 morphants varies in a dose-dependent manner. (A) Alignment of the three zebrafish MBNL genes and morpholinos 1 (blue box) and 2 (green box), showing the specificity of both morpholinos for mbnl2. The initiation codon is boxed in red. (B–D) Control embryos (B) compared with mildly (C) and severely (D) affected morphant embryos at 51 hpf. (F,G) Developmental defects in mbnl2 morphants include hypoplastic hypopigmented eyes and brain malformations; the hindbrain ventricle is swollen or enlarged, producing a convex appearance. (I,J) The hearts are hypoplastic and are elongated (I) or dilated (J), showing pericardial oedema, which results in bradycardia and failure. (K–M) The tails are twisted (L) or shortened (M), and the classic somite chevron-shape (K) is replaced by an oval or U shape (L, M). (B,E,H,K) Control embryos. Inset in E shows a normal wild-type eye. PHENOTYPE:
|
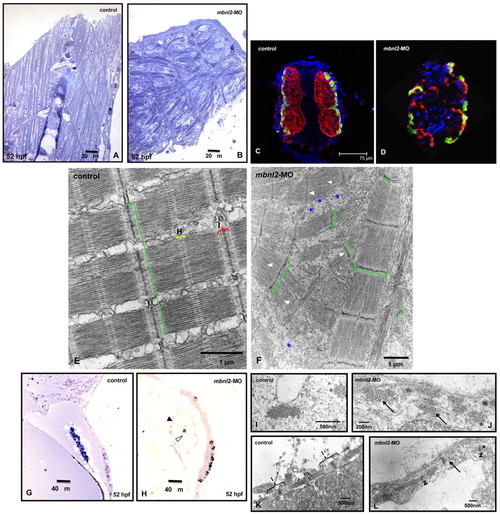
Histological and molecular analyses of skeletal and cardiac muscle of mbnl2 morphants. (A,B) In longitudinal sections through the muscles of the tail of zebrafish embryos at 40× magnification, the controls (A) show a normal somite chevron shape and fibre alignment, whereas the mbnl2 morphants (B) show an abnormal somite shape, and misaligned muscle fibres, which appear scattered in the somitic compartment. (C,D) Immunofluorescence staining with S58 and MF20 antibodies in transverse sections of 52-hpf zebrafish embryos shows slow (S58 positive; yellowish green) and fast (S58 negative, MF20 positive; red) fibre distribution in somitic muscles of control embryos (C) compared with mbnl2 morphants (D); DAPI was used as a blue nuclear counterstain. (E) Electron micrographs of skeletal muscle from 52-hpf control zebrafish show that the myofibrils are aligned, their Z-bands are regularly stacked (green square bracket), and H-zones (H) and I-bands (I) are clearly identifiable. (F) mbnl2 morphants show misaligned myofibrils, Z-bands with irregular width, disorganized sarcoplasmic reticulum (*) and short sarcomeres resulting in loss of H-zones and I-bands (arrowheads). (G) In normal zebrafish hearts (20× magnification), the blood cells fill in the atrial cavity (a). (H) By contrast, the heart in mbnl2 morphants is dilated and empty; black arrowhead points to the myocardium and white arrowhead to the endocardium. (I–L) Electron micrographs of sections through the hearts of zebrafish embryos. Tightly organized myofibril bundles can be seen in transverse sections of wild-type controls (I), whereas dispersed myofibrils (arrows) are apparent in the mbnl2 morphant embryos (J). (K) Longitudinal sections showing normal sarcomeric organization of the Z-line (z), H-zone (h), I-band (I) and M-line (m) in controls. (L) The myofibrils are less organized and sometimes disrupted (arrow) in the morphants, condensation of the Z-bands in the sarcomere can be seen (*), and H-zone and I-band are not recognizable in severe cases. EXPRESSION / LABELING:
PHENOTYPE:
|
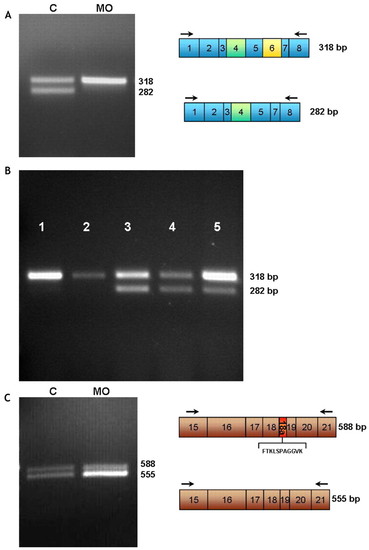
Expression of alternatively spliced transcripts in mbnl2 morphants. (A) RT-PCR analysis using primers tnnt2F and tnnt2R3 (arrows) yields two main bands of 318 bp and 282 bp in control embryos (‘C’), whereas the 282 bp product is not detectable in the morphants (MO). Boxes depict the exon content of each product after sequencing. Exons 4 (green) and 6 (yellow) are alternatively spliced. (B) The normal tnnt2 alternative splicing pattern is shown at different developmental stages. RT-PCR analysis of control embryos at the 18-somite stage (1) and 24 hpf (2) shows the expression of a 318 bp product. 51 hpf (3), 76 hpf (4) and adult (5) controls express both isoforms, 318 bp and 282 bp. (C) RT-PCR analysis of clcn1. Primers clcn1-134F and clcn1-87R (arrows) produce two bands, one of 588 bp (including exon 18a) and one of 555 bp (excluding exon 18a), which are expressed at a ratio of 1:1.2 in control embryos, whereas, in the mbnl2 morphants, the 555 bp product is the predominant form, shifting the ratio to 1:1.98. Differences in exon content are shown in the boxes. Exon 18a (red) is alternatively spliced and encodes amino acids FTKLSPAGGVK. EXPRESSION / LABELING:
|
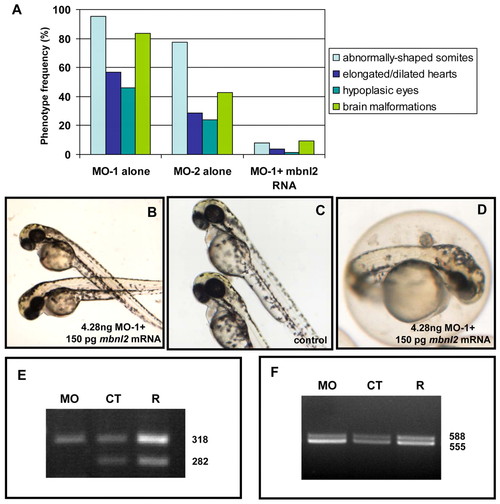
The mbnl2 morphant phenotype can be rescued by mbnl2 and MBNL2 mRNAs, in a dose-dependent manner. (A) The phenotype induced by MO-1 is rescued by co-injection with mbnl2 mRNA. The histogram shows the frequency of the observed phenotype after injection of 4.28 ng MO-1 or the same amount of MO-2 (n=100, from five independent experiments). The percentage of affected embryos is significantly reduced when 150 pg mbnl2 mRNA is co-injected with 4.28 ng MO-1. (B,C) The completely rescued embryos (B) are indistinguishable from the controls (C). (D) The partially rescued embryos show a mild phenotype consisting of the presence of slight eye pigmentation defects, minor heart hypoplasia, mild spinal defects, and a head that is protuberant at the fourth ventricle level of the hindbrain. (E,F) The normal splicing pattern of tnnt2 (E) and clcn1 (F) is restored by co-injection of MO-1 with mbnl2 mRNA. The ratio of the upper and lower band is 1:2 in the morphants (MO), whereas, in controls (CT), it is 1:1.46, and is 1:1.34 in the rescued embryos (R). When co-injecting the human homologue, 75 pg of MBNL2 mRNA is the most effective dose in compensating the phenotype induced by MO-1 (Table 2). PHENOTYPE:
|

Quantitative RT-PCR analysis of mbnl2 MO-1 treated embryos showed that knockdown of mbnl2 does not significantly affect the levels of mbnl1 or mbnl3. The bar graph shows the relative expression levels of mbnl1 (green), mbnl2 (pink) and mbnl3 (salmon). Each gene was assessed in triplicate in three biological replicates. The procedure is described fully in supplementary methods. EXPRESSION / LABELING:
|
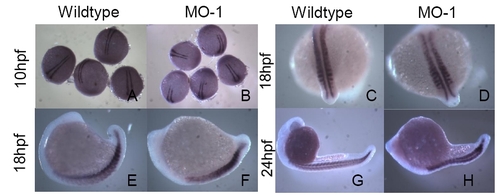
Expression of myoD in wild type and mbnl2 MO-1 knockdown zebrafishembyrosat 10hpf (A-B), 18hpf (C-F) and 24hpf (G-H). Two stripes of myoD expression are observed during the tailbudstage (A, B) and appear similar in wild type and MO-1-treated embryos. At 18hpf somites are distinguishable (C-F) and the pattern of myoD expression appears altered slightly in knockdown embryos compared to wild types with reduced expression in the more anterior somites of the morphants (D). Lateral views of this stage show defined chevron patterning in wild type embryos (E) but in the morphants (F) the somitemorphology is more rounded and flattened. During the late segmentation stage (24hpf) myoD is clearly expressed in the somites of wild-type embryos in a highly defined chevron pattern (G). In the morphants (H), the tail is shortened and the somites have an abnormal disc-like morphology. |
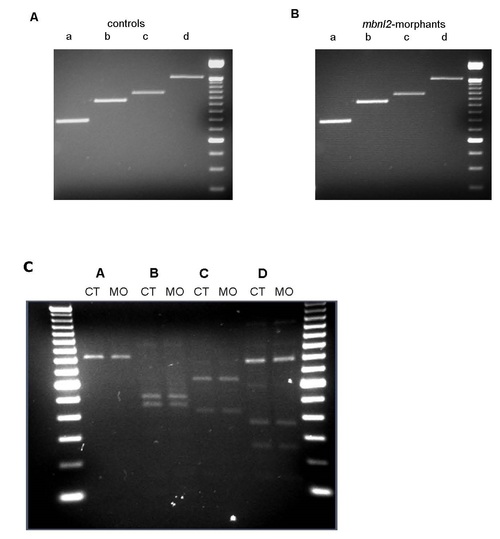
Expression analysis of zebrafish scn4ab. RT-PCR assays carried out in 51 hpf control (A) and morphant (B) zebrafish embryos. No difference in product size was found when using four different sets of primers (a, b, c, d). Last lane to the right contains a 100 bp ladder. (C) Purified RT-PCR products (a, b, c and d) were analyzed by a combination of restriction enzyme digests. The sizes of the restriction products obtained from 51 hpf controls (CT) and morphants (MO) are listed in Table S1. EXPRESSION / LABELING:
|

Unillustrated author statements PHENOTYPE:
|