
- Title
-
Control of Directed Cell Migration In Vivo by Membrane-to-Cortex Attachment
- Authors
- Diz-Munoz, A., Krieg, M., Bergert, M., Ibarlucea-Benitez, I., Muller, D.J., Paluch, E., and Heisenberg, C.P.
- Source
- Full text @ PLoS Biol.
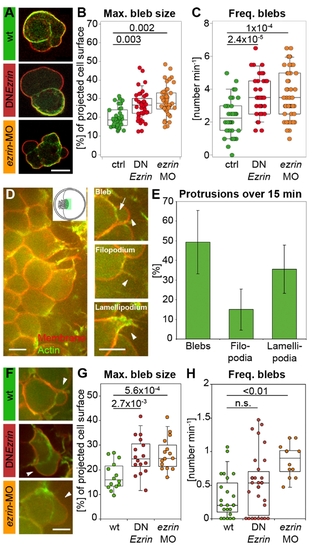
ERM proteins modulate prechordal plate progenitor cell protrusion formation. (A) Examples of isolated control and ERM-deficient prechordal plate progenitor cells. (B) Maximum bleb size in isolated control and ERM-deficient prechordal plate progenitor cells. (C) Frequency of bleb formation in isolated control and ERM-deficient prechordal plate progenitor cells. (D) Animal view of the leading edge of a wt prechordal plate. Inset shows a schematic animal view of an embryo at 80% epiboly, with the green rectangle marking the imaged area in (D). Examples of a bleb, filopodium, and lamellipodium in prechordal plate leading edge cells. Arrowheads point to the protrusions. Arrow indicates the separation between actin cortex and membrane in the bleb. (E) Percentage of blebs, filopodia, and lamellipodia in wt prechordal plate leading edge cells (mean ± half standard deviation). (F) Example blebs (arrowheads) in wt and ERM-deficient prechordal plate leading edge cells. (G) Maximum bleb size in wt and ERM-deficient prechordal plate leading edge cells. (H) Frequency of bleb formation in wt and ERM-deficient prechordal plate leading edge cells. Plasma membrane (GPI-RFP) is red; actin cortex (Lifeact-GFP) is green. Scale bars = 10 μm. The projected bleb size in (B) and (G) was normalized to the projected cell size. Number of analyzed blebs in (B) and (C) = 39 (control), 42 (DNEzrin), and 51 (ezrin-MO) and in (G) = 14 (wt), 16 (DNEzrin), and 15 (ezrin-MO). Number of analyzed cells in (E) and (H) = 23 (wt), 30 (DNEzrin), and 12 (ezrin-MO). Statistical significance was determined using t test (G) or Mann?Whitney U test (B, C, and H). PHENOTYPE:
|
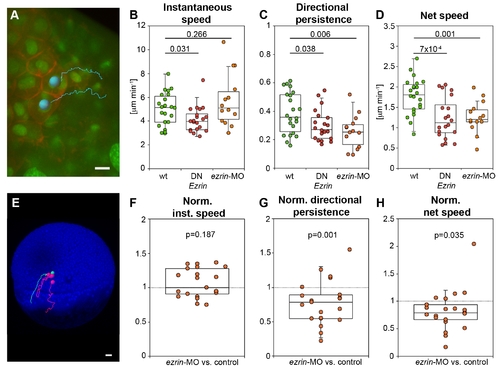
ERM proteins modulate prechordal plate progenitor cell migration. (A) Animal view of the leading edge of a wt prechordal plate with example tracks of cell nuclei movements (tracking time = 25 min). Plasma membrane (GPI-RFP) is red; nuclei (Histone-Alexa-488) are green. Scale bar = 10 μm. (B?D) Instantaneous speed (B), directional persistence (C), and net speed (D) of prechordal plate leading edge cell migration in wt and ERM-deficient embryos. (E) Lateral view of a MZoep mutant embryo (blue) at 50% epiboly (6 hpf) with example tracks of control (green) and ERM-deficient mesendoderm cells (red) transplanted into the lateral germ ring margin at the onset of gastrulation (5 hpf). Tracking time = 110 min. Scale bar = 50 μm. (F?H) Instantaneous speed (F), directional persistence (G), and net speed (H) of transplanted ERM-deficient single lateral mesendoderm cells. Note that the values for speeds and directional persistence were plotted as ratios relative to transplanted control cells in the same embryo (internal controls) to reduce experimental variability between different embryos. Number of analyzed cells in (B?D) = 22 (wt), 20 (DNEzrin), 13 (ezrin-MO), and in (F?H) = 21 ezrin-MO compared to control. Statistical significance was determined using t test (B?D) or Matlab ttest2 (F?H). PHENOTYPE:
|
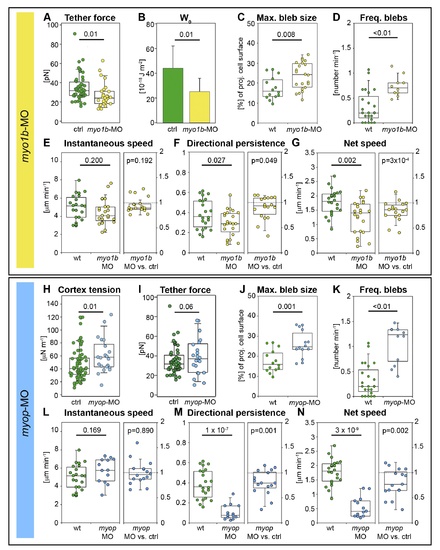
Myosin1b and Myosin phosphatase modulate prechordal plate progenitor cell protrusion formation and migration. (A) Static tether forces of isolated prechordal plate progenitor control and Myosin1b-deficient cells. (B) Adhesion energy density calculated from data presented in (A) using Equation 1. Error bars indicate absolute deviation of the median. (C) Maximum bleb size in wt and Myosin1b-deficient leading edge prechordal plate progenitor cells. (D) Frequency of bleb formation in wt and Myosin1b-deficient leading edge prechordal plate progenitor cells. (E?G) Instantaneous speed (E), directional persistence (F), and net speed (G) of prechordal plate leading edge cell migration in wt and Myosin1b-deficient embryos (left panels) and instantaneous speed, directional persistence, and net speed ratios (relative to co-transplanted control cells in the same embryo) of Myosin1b-deficient single lateral mesendoderm cells transplanted into MZoep mutant embryos (right panels). (H) Cortex tension of isolated control and MyoP-deficient prechordal plate progenitor cells. (I) Static tether forces of isolated control and MyoP-deficient prechordal plate progenitor cells. (J) Maximum bleb size in wt and MyoP-deficient prechordal plate leading edge cells. (K) Frequency of bleb formation in wt and MyoP-deficient prechordal plate leading edge cells. (L?N) Instantaneous speed (L), directional persistence (M), and net speed (N) of prechordal plate leading edge cell migration in wt and MyoP-deficient embryos (left panels), and instantaneous speed, directional persistence, and net speed ratios (relative to co-transplanted control cells in the same embryo) of MyoP-deficient single lateral mesendoderm cells transplanted into MZoep mutant embryos (right panels). Bleb size was normalized to cell size (C and J) as in Figure 2. Number of analyzed blebs in (C) and (J) = 14 (wt), 22 (myo1b-MO), and 14 (myop-MO). Number of analyzed cells in (D) and (K) = 23 (wt), 10 (myo1b-MO), and 12 (myop-MO); in left panels of (E?G) = 22 (wt) and 23 (myo1b-MO); in right panels of (E?G) = 18 myo1b-MO versus control; in left panels of (L?N) = 22 (wt) and 13 (myop-MO); and in right panels of (L?N) = 16 myoP-MO versus control. Statistical significance was determined using t test for (C), left panels of (E?G), (I), and left panels of (L?N); Mann?Whitney U test for (A, B, D, H, I, and K); or Matlab ttest2 for right panels of (E?G) and (L?N). PHENOTYPE:
|
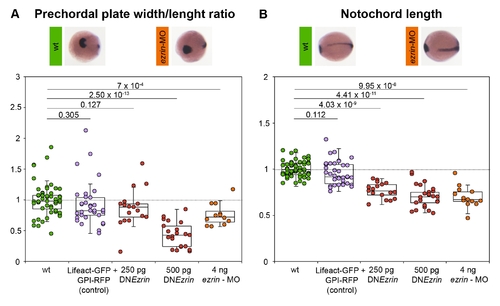
ERM-deficient embryos show reduced convergence and extension movements during gastrulation. (A) Quantification of prechordal plate width-to-length ratio (normalized to wt) in embryos expressing either GPI-RFP and Lifeact-GFP alone (control) or together with DNEzrin (250 pg), DNEzrin (500 pg), or ezrin-MO (4 ng) at the bud stage (10 hpf) stained for notail (ntl) marking the notochord, distal-less homeobox 3 (dlx3) marking the anterior edge of the neural plate, and hatching gland gene-1 (hgg1) marking the prechordal plate. (B) Quantification of notochord length (normalized to wt) of control and experimental embryos. p-values were calculated using t test. Pictures are representative examples of wt and morphant embryos stained in situ. For methods see Text S1. |
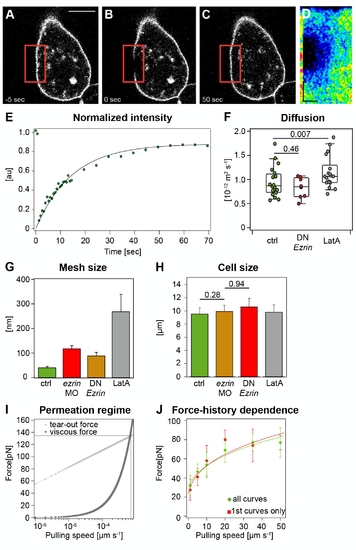
Physical properties of the plasma membrane and cortex in control and ERM-deficient prechordal plate progenitor cells. (A?F) Plasma membrane fluidity measurements of control and ERM-deficient prechordal plate progenitor cells. Sequential images of a typical FRAP experiment before bleaching (A), directly after bleaching (B), and after complete recovery (C). Red square demarcates bleached region. (D) Kymograph of the bleached region. The kymograph was calculated on a line (width = one pixel) encompassing the bleached region of the cell membrane within the red box. Recovery occurs from the rims of the bleached area. Scale bars: in y = 5 μm and in x = 9 s. (E) Example of a recovery curve for a prechordal plate progenitor cell expressing GAP43-GFP. (F) Diffusion coefficient extracted from FRAP experiments in control, ERM-deficient, and LatA-treated prechordal plate progenitor cells. For more details see Text S1. (G) Average lateral separation between plasma-membrane-to-cortex cross-linking molecules of control, ERM-deficient, and LatA-treated prechordal plate progenitor cells. Error bars indicate error propagated from the fit. (H) Cell radius measured during cortical tension measurements. Error bars indicate error propagated from the fit. p-value was estimated using t test. (I) Estimation of the range of velocities for which Equation 2 is valid. The plot represents theoretical curves, computed as in [52], of the forces exerted on transmembrane proteins during tether extraction. The friction force (Ff, dark grey squares) due to the flow of membrane into the tether increases linearly with pulling velocities, whereas the rupture force (Fr, light grey squares), at which the transmembrane protein would unbind from the cortex, increases logarithmically. The intersection between these two curves (600 μm�s-1) gives the critical velocity at which transmembrane proteins unbind from the cortex. Therefore, the velocities we used for tether pulling (lower than 100 μm�s-1) are suitable to estimate ν. The parameters used to compute the curves are the membrane viscosity (1.5x10⁻⁷ Pa?m?s; see Materials and Methods) and the typical distance between cortex?membrane linkers (0.35 nm [53]). (J) Comparison between the extrusion force of the first tether that has been extruded from a cell and the tether force of all measurements shows that force is not influenced by the pulling history. The fit parameters are a = 9,969 and F0 = 32 pN for ?all curves? and a = 11,612 and F0 = 25 pN for ?first curves.? |