
Fig. 3
- ID
- ZDB-FIG-101223-9
- Publication
- Diz-Munoz et al., 2010 - Control of Directed Cell Migration In Vivo by Membrane-to-Cortex Attachment
- Other Figures
- All Figure Page
- Back to All Figure Page
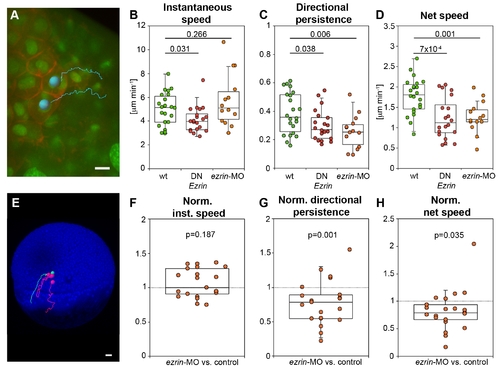
ERM proteins modulate prechordal plate progenitor cell migration. (A) Animal view of the leading edge of a wt prechordal plate with example tracks of cell nuclei movements (tracking time = 25 min). Plasma membrane (GPI-RFP) is red; nuclei (Histone-Alexa-488) are green. Scale bar = 10 μm. (B–D) Instantaneous speed (B), directional persistence (C), and net speed (D) of prechordal plate leading edge cell migration in wt and ERM-deficient embryos. (E) Lateral view of a MZoep mutant embryo (blue) at 50% epiboly (6 hpf) with example tracks of control (green) and ERM-deficient mesendoderm cells (red) transplanted into the lateral germ ring margin at the onset of gastrulation (5 hpf). Tracking time = 110 min. Scale bar = 50 μm. (F–H) Instantaneous speed (F), directional persistence (G), and net speed (H) of transplanted ERM-deficient single lateral mesendoderm cells. Note that the values for speeds and directional persistence were plotted as ratios relative to transplanted control cells in the same embryo (internal controls) to reduce experimental variability between different embryos. Number of analyzed cells in (B–D) = 22 (wt), 20 (DNEzrin), 13 (ezrin-MO), and in (F–H) = 21 ezrin-MO compared to control. Statistical significance was determined using t test (B–D) or Matlab ttest2 (F–H). |
| Fish: | |
|---|---|
| Knockdown Reagent: | |
| Observed In: | |
| Stage Range: | 75%-epiboly to 90%-epiboly |