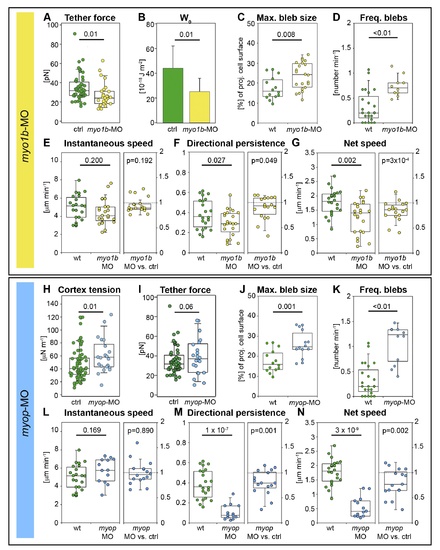
Myosin1b and Myosin phosphatase modulate prechordal plate progenitor cell protrusion formation and migration. (A) Static tether forces of isolated prechordal plate progenitor control and Myosin1b-deficient cells. (B) Adhesion energy density calculated from data presented in (A) using Equation 1. Error bars indicate absolute deviation of the median. (C) Maximum bleb size in wt and Myosin1b-deficient leading edge prechordal plate progenitor cells. (D) Frequency of bleb formation in wt and Myosin1b-deficient leading edge prechordal plate progenitor cells. (E–G) Instantaneous speed (E), directional persistence (F), and net speed (G) of prechordal plate leading edge cell migration in wt and Myosin1b-deficient embryos (left panels) and instantaneous speed, directional persistence, and net speed ratios (relative to co-transplanted control cells in the same embryo) of Myosin1b-deficient single lateral mesendoderm cells transplanted into MZoep mutant embryos (right panels). (H) Cortex tension of isolated control and MyoP-deficient prechordal plate progenitor cells. (I) Static tether forces of isolated control and MyoP-deficient prechordal plate progenitor cells. (J) Maximum bleb size in wt and MyoP-deficient prechordal plate leading edge cells. (K) Frequency of bleb formation in wt and MyoP-deficient prechordal plate leading edge cells. (L–N) Instantaneous speed (L), directional persistence (M), and net speed (N) of prechordal plate leading edge cell migration in wt and MyoP-deficient embryos (left panels), and instantaneous speed, directional persistence, and net speed ratios (relative to co-transplanted control cells in the same embryo) of MyoP-deficient single lateral mesendoderm cells transplanted into MZoep mutant embryos (right panels). Bleb size was normalized to cell size (C and J) as in Figure 2. Number of analyzed blebs in (C) and (J) = 14 (wt), 22 (myo1b-MO), and 14 (myop-MO). Number of analyzed cells in (D) and (K) = 23 (wt), 10 (myo1b-MO), and 12 (myop-MO); in left panels of (E–G) = 22 (wt) and 23 (myo1b-MO); in right panels of (E–G) = 18 myo1b-MO versus control; in left panels of (L–N) = 22 (wt) and 13 (myop-MO); and in right panels of (L–N) = 16 myoP-MO versus control. Statistical significance was determined using t test for (C), left panels of (E–G), (I), and left panels of (L–N); Mann–Whitney U test for (A, B, D, H, I, and K); or Matlab ttest2 for right panels of (E–G) and (L–N).
|
