
Fig. 3
- ID
- ZDB-IMAGE-260310-39
- Genes
- Publication
- Hillman et al., 2025 - Genetic disruption of leucine rich repeat transmembrane protein 4 like 1 induces a pro-social behavioural phenotype in zebrafish
- All Figures
- Figures for Hillman et al., 2025
|
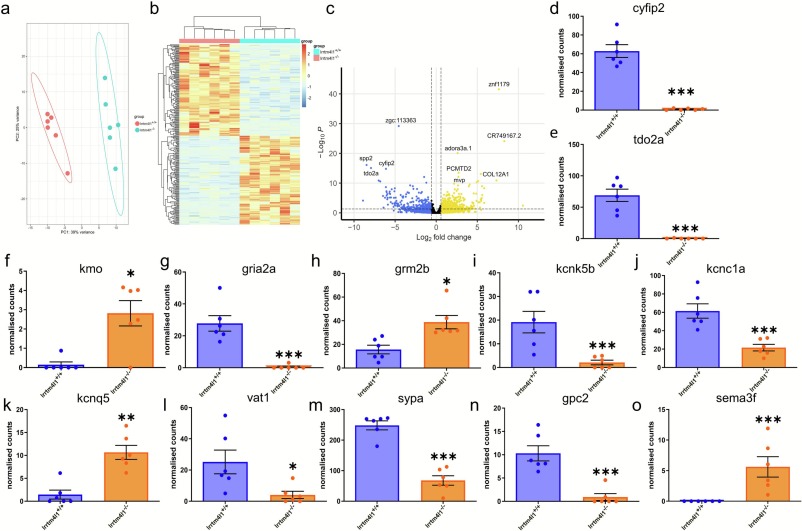
Fig. 3 Neurotranscriptomic differences between lrrtm4l1+/+ and lrrtm4l1−/− zebrafish. a) Principal component analysis plot of the 200 most variable genes after differential expression analysis between lrrtm4l1−/− and lrrtm4l1+/+ zebrafish. n = 6/group. (b) Heatmap of differentially expressed genes (DEGs; padj <0.05 and LFC > |0.58|) between lrrtm4l1−/− and lrrtm4l1+/+ zebrafish. Hierarchical clustering of samples and genes reveals large differences between lrrtm4l1−/− and lrrtm4l1+/+ zebrafish, but similar transcriptional patterns within the two lines. n = 6/group. (c) Volcano plot displaying the most significant DEGs between lrrtm4l1−/− and lrrtm4l1+/+ zebrafish. Golden dots indicate genes upregulated in lrrtm4l1−/− zebrafish more than log fold change 0.58, blue dots represent genes downregulated in lrrtm4l1−/− zebrafish more than LFC –0.58 and black dots represent genes not passing these thresholds as indicated by vertical dotted lines. n = 6/group. (d-o) Selected DEGs between lrrtm4l1+/+ and lrrtm4l1−/− zebrafish. (d) cytoplasmic FMRP-interacting protein 2 (cyfip2), (e) tryptophan 2,3-dioxygenase a (tdo2a), (f) kynurenine 3-monooxygenase (kmo), (g) glutamate receptor, ionotropic, AMPA 2a (gria2a), (h) glutamate receptor, metabotropic 2a (grm2), (i) potassium channel, subfamily K, member 5b (kcnk5b), (j) potassium voltage-gated channel, Shaw-related subfamily, member 1a (kcnc1a), (k) potassium voltage-gated channel, KQT-like subfamily, member 5a (kcnq5a), (l) vesicle amine transport 1 (vat1), (m) synaptophysin a (sypa), (n) glypican 2 (gpc2), (o) semaphorin 3F (sema3f). n = 6/group. Wald test with Benjamini-Hochberg correction. ***P < .001; **P < .01; *P < .05 lrrtm4l1−/− vs lrrtm4l1+/+. Data in d-o are DESeq2-normalised counts presented as mean ± SEM. (For interpretation of the references to colour in this figure legend, the reader is referred to the web version of this article.)