IMAGE

Figure 5

ID
ZDB-IMAGE-260101-74
Genes
Source
Figures for Che et al., 2025
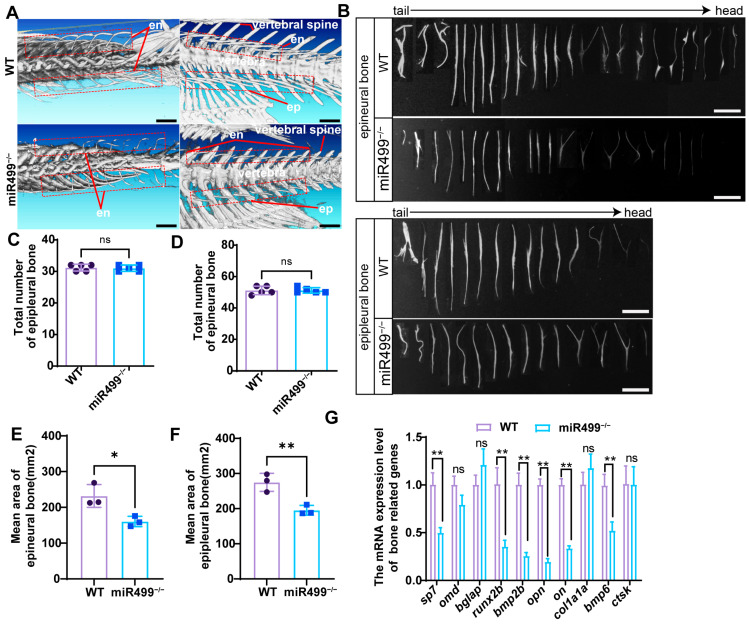
Image
Figure Caption

Figure 5

miR499 diminished the ossification of intermuscular bones in zebrafish. (A) Micro-CT imaging of whole-body skeletons, revealing reduced IB ossification area in miR499−/− zebrafish. en: epineural bone; ep: epipleural bone. Red dashed boxes indicate partial intermuscular bones (IBs); (B) Isolated IBs from zebrafish (scale bar = 500 μm); (C,D) Quantification of the number of epineural bones and epipleural bones. N = 5; (E,F) Quantification of IB ossification mean area at 3 mpf. N = 3. * p < 0.05, ** p < 0.01; (G) qRT-PCR analysis of bone-related gene expression in IB tissues separated from muscle. Data are presented as mean ± SD; * p < 0.05, ** p < 0.01. ns: no significance.

Figure Data
Acknowledgments
This image is the copyrighted work of the attributed author or publisher, and ZFIN has permission only to display this image to its users. Additional permissions should be obtained from the applicable author or publisher of the image. Full text @ Biology (Basel)