
IMAGE

Figure 2

ID
ZDB-IMAGE-260101-71
Genes
Publication
Che et al., 2025 - The Mutation of myomiR miR499 Impacts the Intermuscular Bones in Zebrafish
All Figures
Figures for Che et al., 2025
Image
Figure Caption

Figure 2

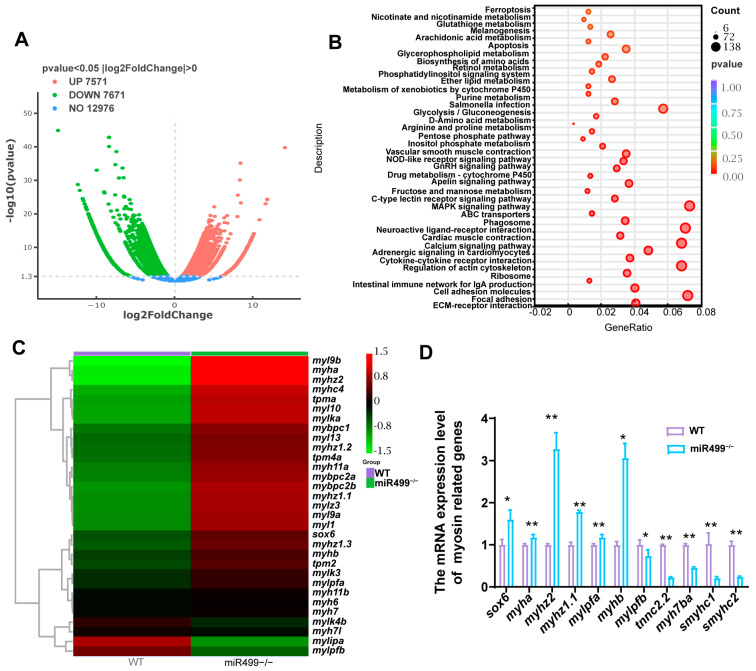
Transcriptomic analysis of muscle tissue in WT and miR499−/− zebrafish at 3 months old. (A) Volcano plot showing differentially expressed genes between WT and miR499−/− zebrafish (red dots: up—regulated genes; green dots: down—regulated genes; blue dots: genes with no significant change); (B) Bubble plot of pathway enrichment analysis for differentially expressed genes (Top40). The size of bubbles represents gene count, and color represents p–value. Red indicates high expression. Green indicates low expression; (C) Hierarchical clustering of the muscle-related DEGs in miR499−/− mutants compared with WT; (D) qPCR validation of expression levels of selected myosin—related and red muscle—specific genes. ** p < 0.01, * p < 0.05.

Figure Data
Acknowledgments
This image is the copyrighted work of the attributed author or publisher, and ZFIN has permission only to display this image to its users. Additional permissions should be obtained from the applicable author or publisher of the image. Full text @ Biology (Basel)