
Fig. 4
- ID
- ZDB-IMAGE-250828-11
- Genes
- Publication
- Parisien-La Salle et al., 2025 - Rapid generation of a sdhb loss-of-function zebrafish model for secreting pheochromocytomas and paragangliomas
- All Figures
- Figures for Parisien-La Salle et al., 2025
|
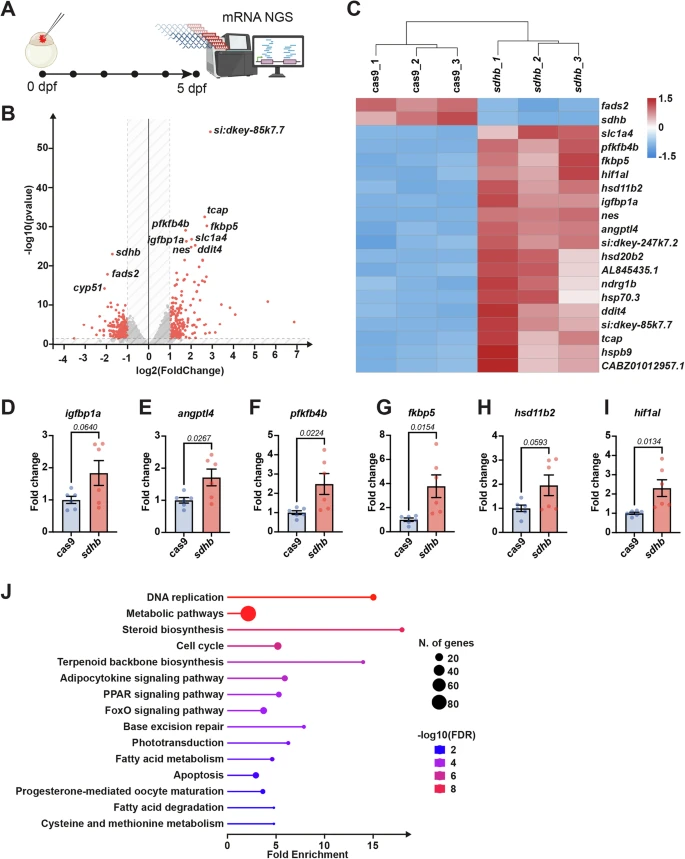
Fig. 4 Transcriptomic changes in sdhb CRISPants.A Experimental timeline from one-cell stage embryo microinjection to whole larvae mRNA extraction at 5 dpf for RNA-sequencing. B Volcano plot with differentially expressed genes (DEGs) in red (filtered with a value < 0.05 and an absolute log2FoldChange > 1). The full list of DEGs is available in Supplementary Data 1. C Heatmap representing the top 20 DEGs between sdhb-CRISPant samples (sdhb_1, sdhb_2, sdhb_3) and Cas9 controls (cas9_1, cas9_2, cas9_3). D–I qRT-PCR validation of changes in the expression of relevant genes between sdhb-CRISPant (n = 6 pools of 10 larvae) and Cas9-injected control (n = 6 pools of 10 larvae) at 5 dpf. J Lollipop plot of top 15 significantly enriched KEGG pathways clustered from sdhb vs cas9 DEGs. The complete list of enriched KEGG pathways is available in Supplementary Data 2. Icons in panel A are created in BioRender. Samarut, E. (2025) https://BioRender.com/xk8wiuf.