
|
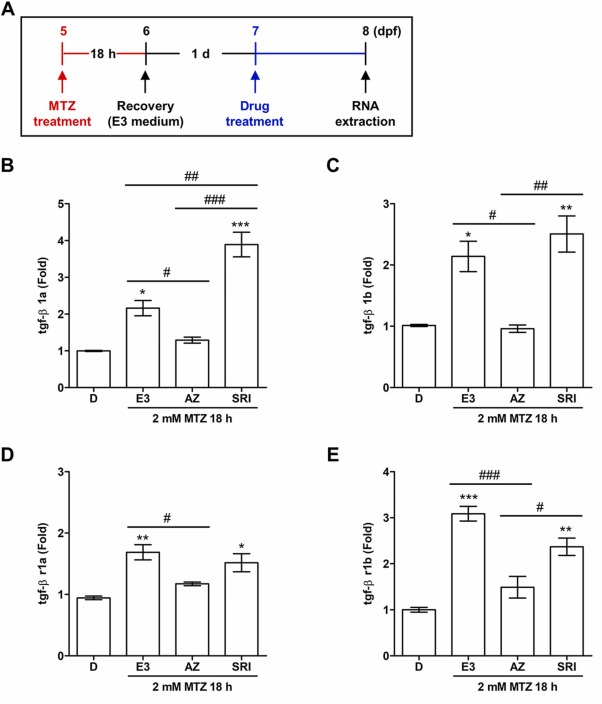
Fig. 4 TGF-βRI kinase inhibitor downregulates TGF-β1 and TGF-βRI mRNA expression levels post-demyelination. (A) Schematic representation of the treatment protocols using Tg(mbpa:qf2;quas:epntr-p2a-mcherry) zebrafish larvae. (B-E) RT-qPCR results for tgf-β1a, tgf-β1b, tgf-βr1a, and tgf-βr1b mRNA expression. The experiment was repeated thrice. The data are presented as the mean ± SD; n ≥ 20 independent experiments. P-values were calculated using one-way ANOVA followed by Tukey’s test. Significance is indicated by *P < 0.05, **P < 0.01, and ***P < 0.001 vs. DMSO; #P < 0.05, ##P < 0.01, and ###P < 0.001 vs. MTZ 18 h + E3 or MTZ 18 h + AZ.