
|
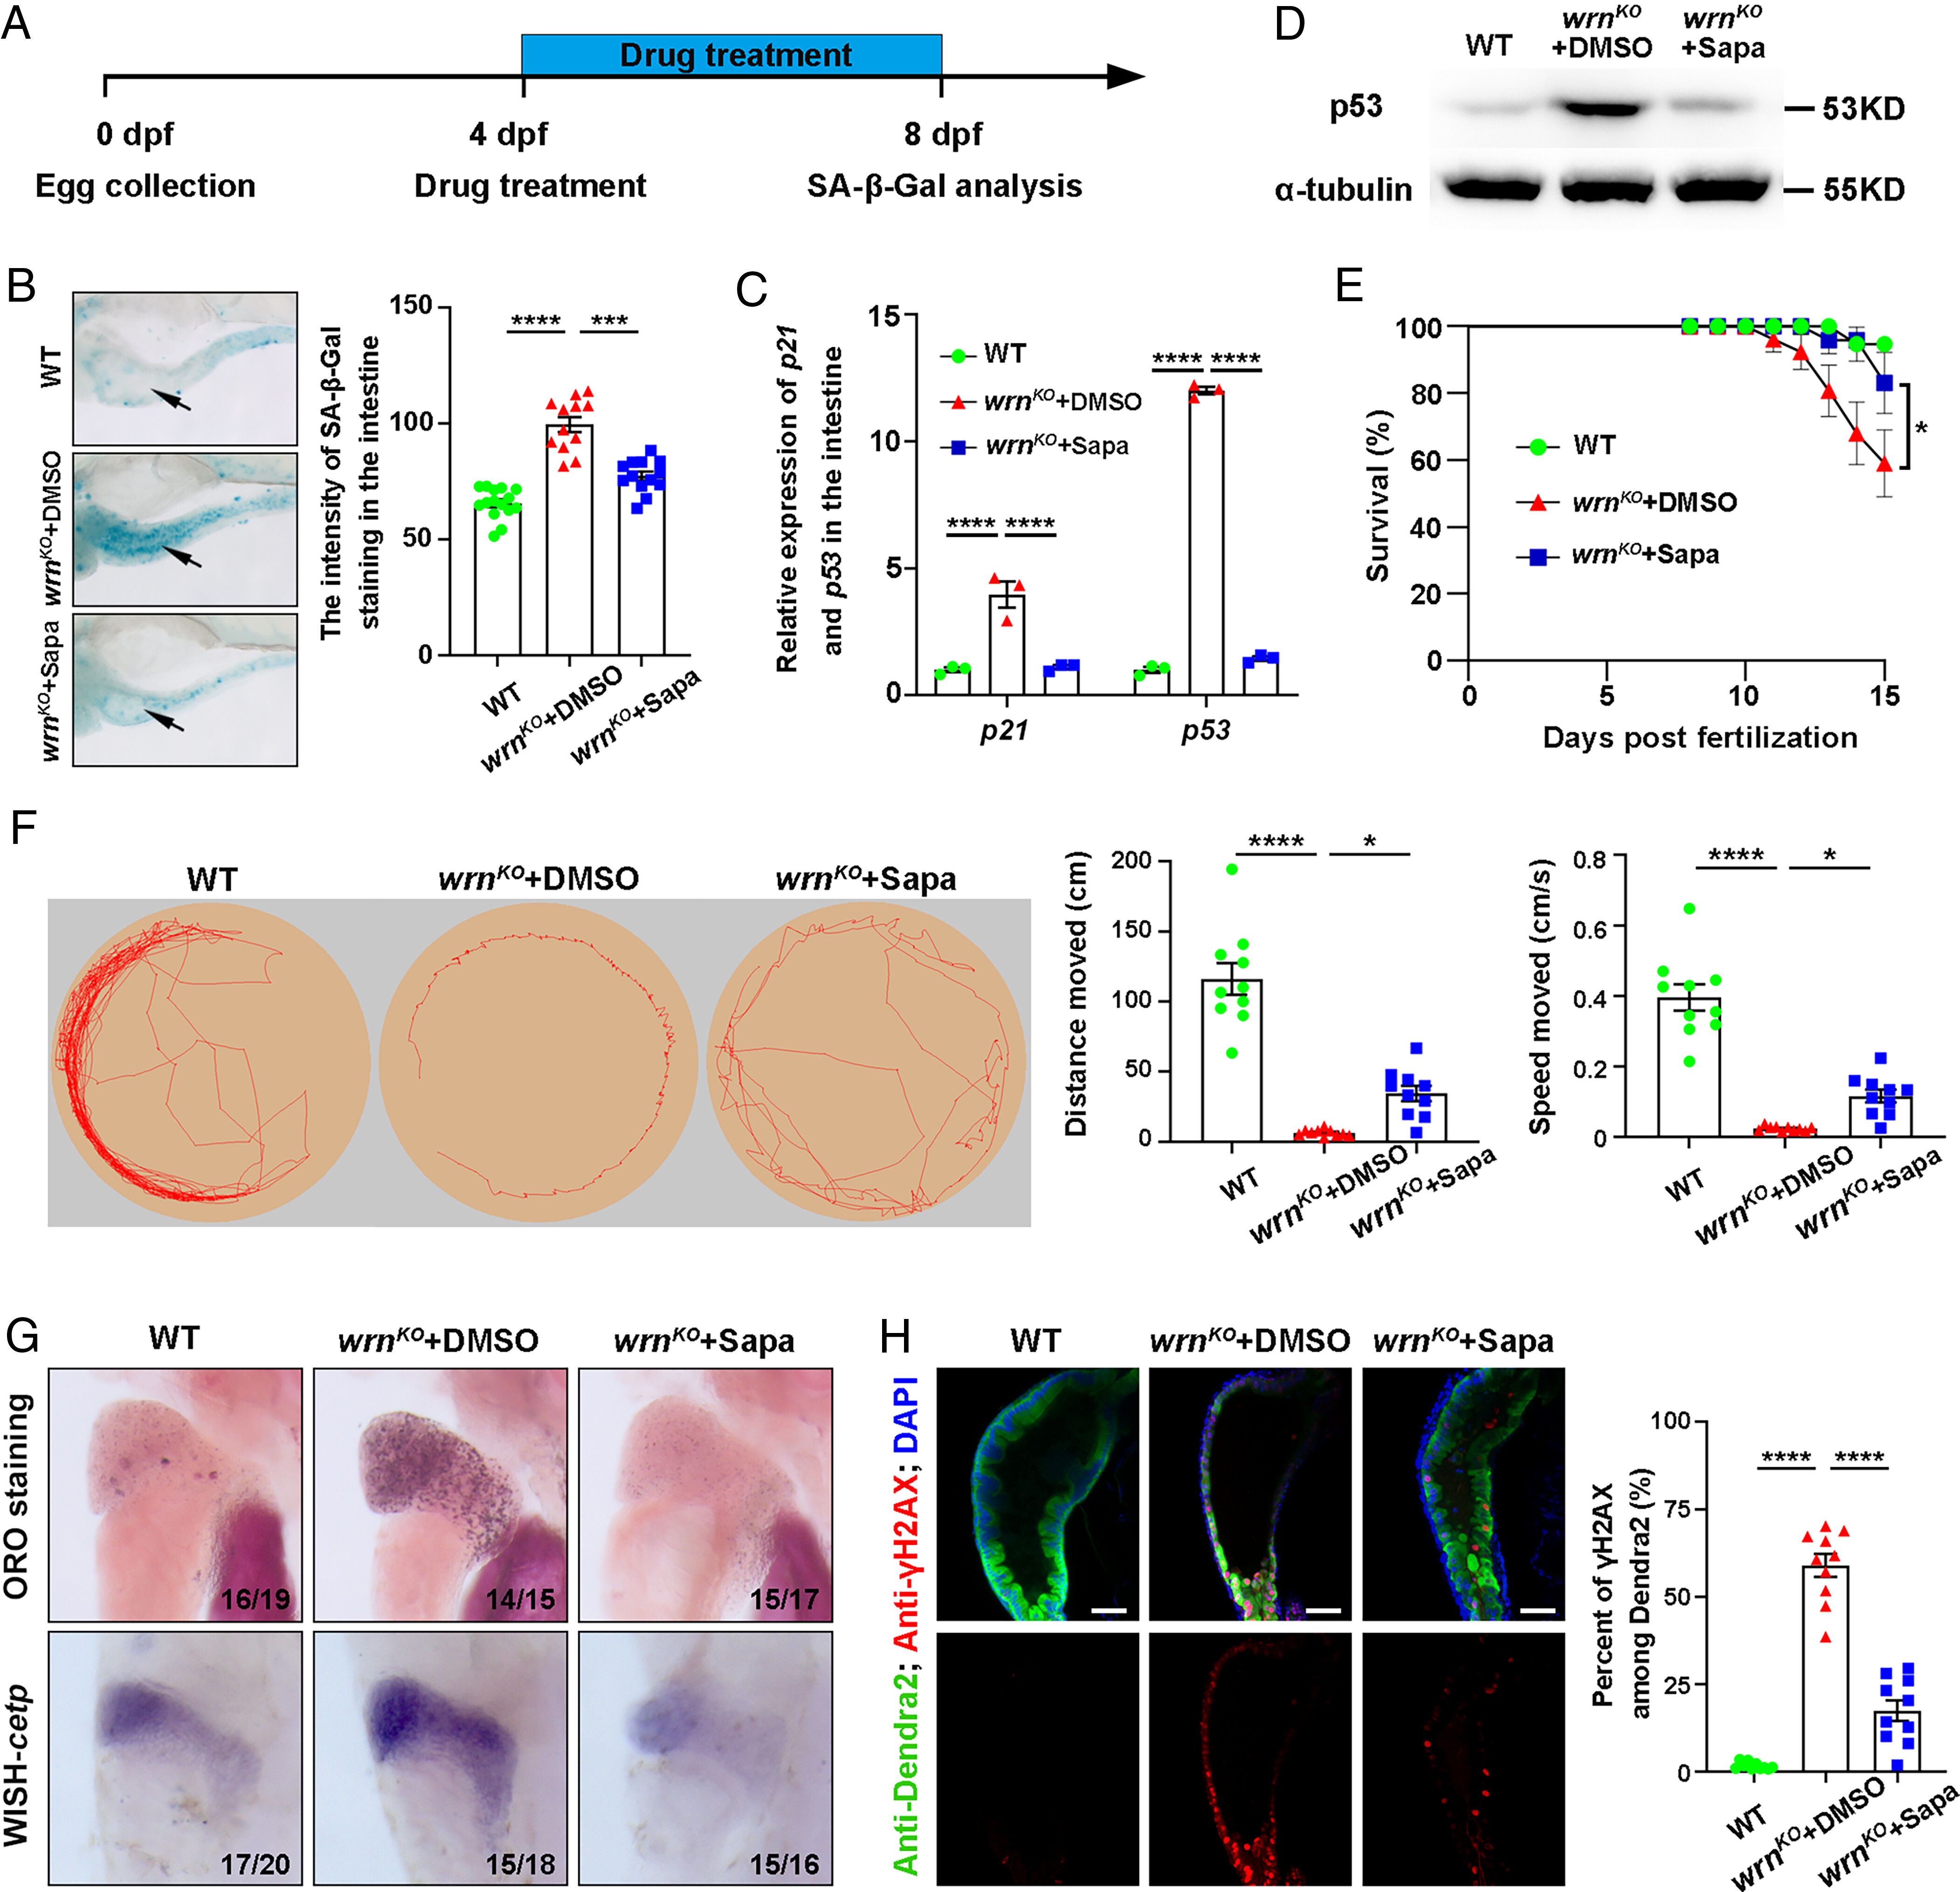
Fig. 3 Drug screening identified that sapanisertib alleviated aging phenotypes in wrnKO mutants. (A) Schematic illustration of antiaging drug screening on the zebrafish wrnKO mutant. (B) Representative image of SA-β-Gal staining and quantification of the intensity of SA-β-Gal staining in the intestine at 8 dpf (n = 12 to 15 for each group). Arrows indicate the intestine region. (C) qPCR analysis of age-related gene expression (p21 and p53) in intestinal samples at 8 dpf (n = 40 for each group). (D) Western blot images of p53 in WT, wrnKO+DMSO, and wrnKO+Sapa groups in intestinal samples at 8 dpf (n = 40 for each group). (E) The percent of survival of the WT (n = 19), wrnKO+DMSO (n = 24), and wrnKO +Sapa (n = 18) groups from 0 dpf to 15 dpf is presented. (F) Representative swimming tracks (Left) and quantification of total distance traveled and swimming speed (Right) among WT, wrnKO + DMSO, and wrnKO +Sapa groups at 15 dpf (n = 10 for each group). The yellow circle represents the recording field, and the red line represents the swimming track. (G) ORO staining and WISH of cetp at 8 dpf. Numbers indicate the proportion of larvae exhibiting the expression shown. (H) Single-optical section images showing the expression of γH2AX (red), Dendra2 (green), and DAPI (blue) in the intestine of Tg(fabp2:Dendra2-NTR) at 8 dpf. Quantification of the percent of γH2AX (n = 10 for each group). (Scale bar, 50 μm.) Data are presented as mean ± SEM. Significance was determined by one-way ANOVA, and the survival rate was analyzed with the log-rank test. *P < 0.05; **P < 0.01; ***P < 0.001; ****P < 0.0001. Sapa, sapanisertib.