
|
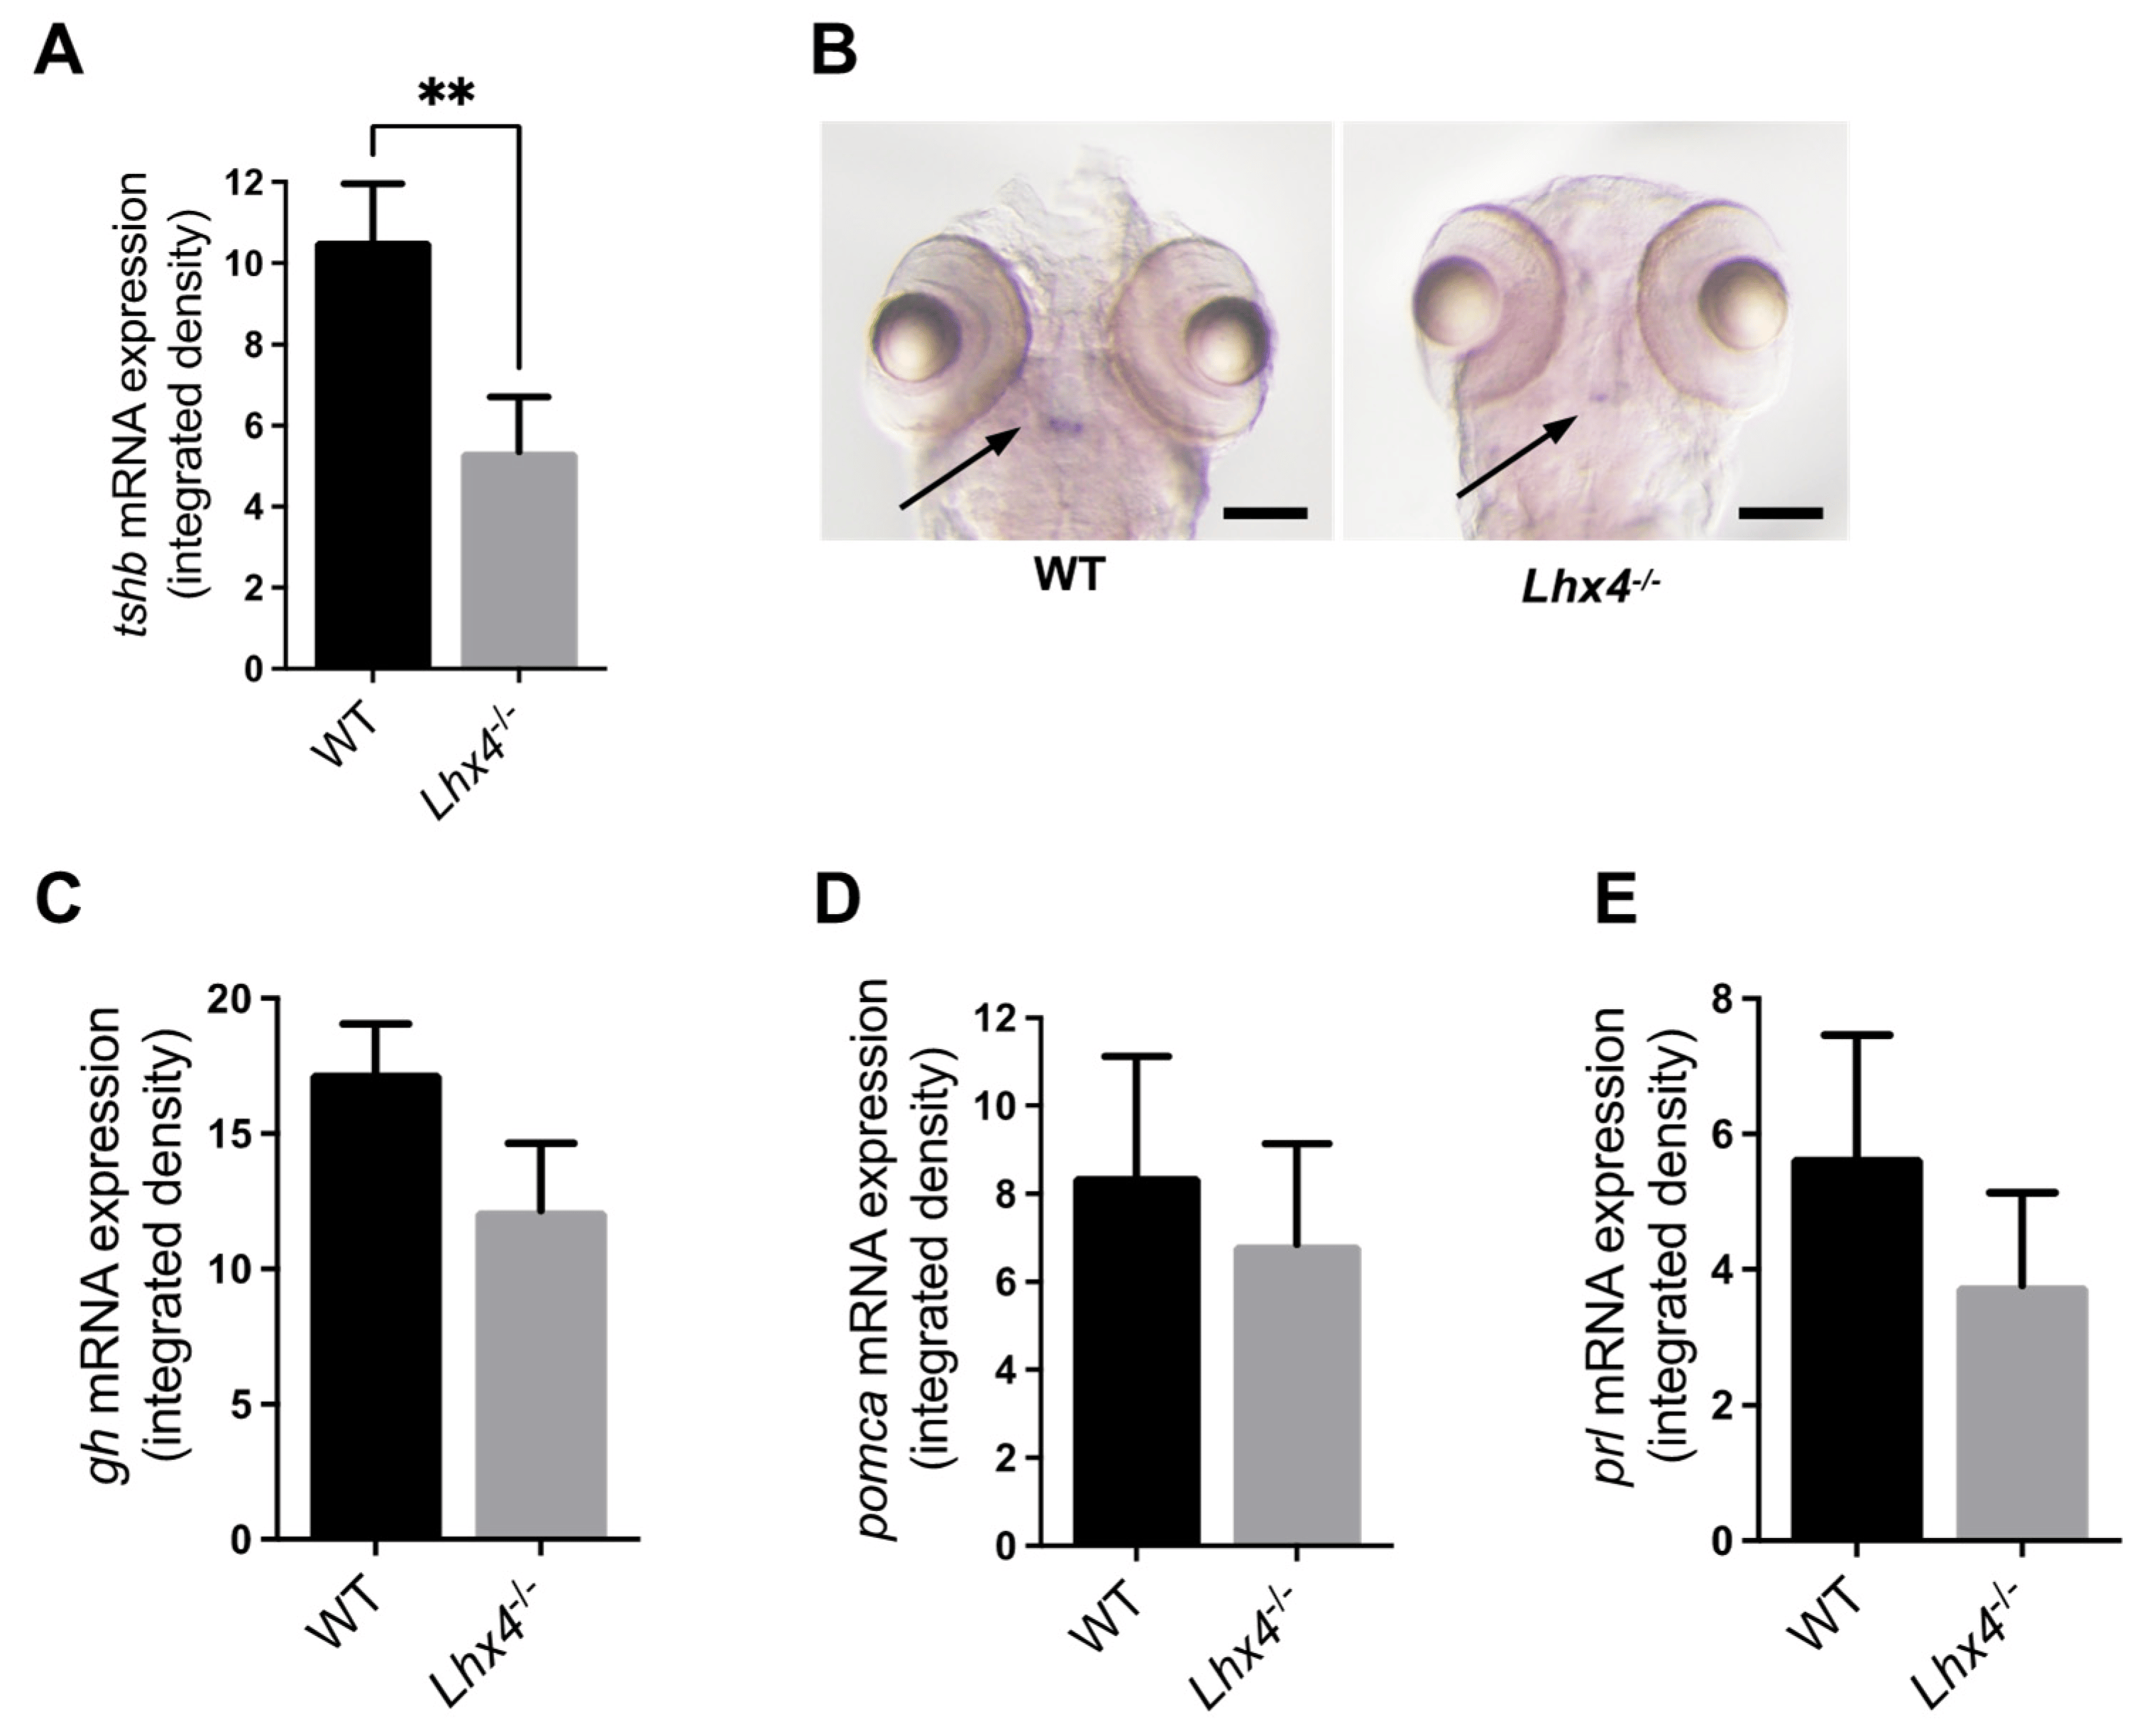
Fig. 3 Whole-mount ISH analysis of pituitary hormone-encoding transcripts in 7 dpf larvae. (A,C–E) Transcript levels measured by the integrated densities of whole-mount-ISH-staining signals of tshb ((A); N = 10 homozygotes and 10 WTs), gh ((C); N = 11 homozygotes and 10 WTs), pomca ((D); N = 9 homozygotes and 4 WTs) and prl ((E); N = 9 homozygotes and 9 WTs) in 7 dpf lhx4 mutants and their WT siblings from heterozygous intercross. Homozygous lhx4 mutants expressed lower amounts of tshb compared with their WT siblings ((A); ** p < 0.01, Mann–Whitney test), while the expressions of gh, pomca and prl remained unaltered (C–E). Error bars indicate s.e.m. (B) Representative samples (heads of 7 dpf larvae, dorsal view) of WT sibling (left) and homozygous lhx4 mutant (right), analyzed by whole-mount ISH using the tshb probe. Tshb ISH signal (denoted by arrows) is considerably reduced in the pituitary of homozygous lhx4 mutant at 7 dpf as compared with its WT sibling. Scale bar = 100 µm.