
Fig. 6
- ID
- ZDB-IMAGE-240620-155
- Genes
- Antibodies
- Publication
- Marchese et al., 2024 - Targeting autophagy impairment improves the phenotype of a novel CLN8 zebrafish model
- All Figures
- Figures for Marchese et al., 2024
|
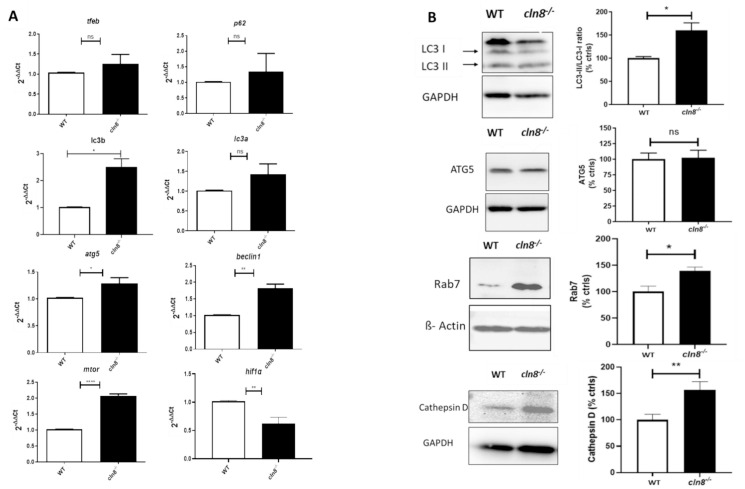
Fig. 6 Analysis of autophagy pathway in cln8−/− mutants. (A) The graphs show the qRT-PCR analysis of autophagy factors, performed by normalizing to β-actin, and comparing cln8−/− larvae with controls at 5 dpf. Three independent samples (each obtained from about 30–40 larvae) from controls and cln8−/− mutant larvae at 120 hpf were analyzed. Statistical analysis (* p ≤ 0.05, **p ≤ 0.01, *** p ≤ 0.001) was performed using Student's t-test. The values are expressed as mean ± standard deviation (SD). (B) Three independent larval homogenates from controls (n = 50) and cln8−/− larvae (n = 50) were tested by Western blotting for the expression of LC3, Rab7, Ctsd, and ATG5 protein. The levels of the proteins were normalized to ß-actin or GAPDH. Statistical analysis (*p ≤ 0.05, **p ≤ 0.01) was performed using Student's t-test. The values are expressed as mean ± standard error of the mean (SEM).