
Figure 5
|
Figure 5
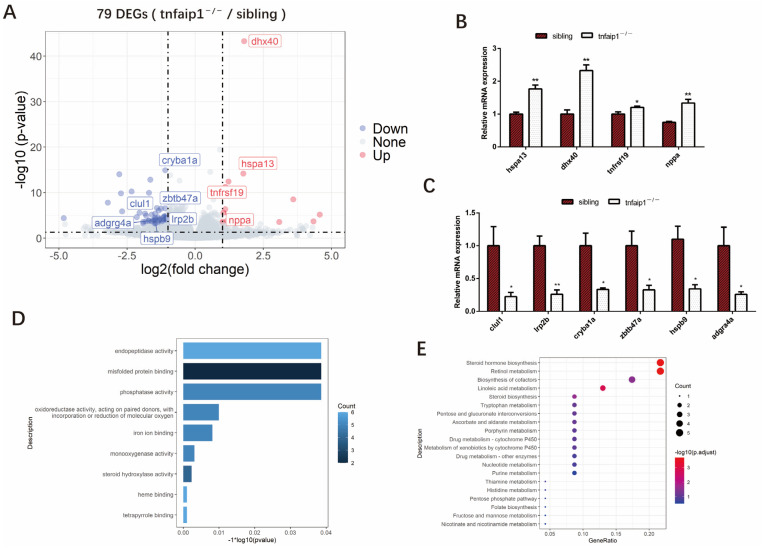
Identification of differentially expressed genes between siblings and tnfaip1−/−. (A) Volcano plot showing the overall differences in upregulated and downregulated genes in the mutants. Some differentially expressed genes are highlighted in the figure. DEGs, differentially expressed genes. (B,C) qPCR validation of differentially expressed genes associated with embryonic development in siblings and tnfaip1−/−. “*” represents p < 0.05, “**” represents p < 0.01, analyzed with unpaired two-tailed t-tests. (D) Gene Ontology (GO) enrichment analysis of differentially expressed genes from siblings and tnfaip1 mutants. (E) KEGG pathway enrichment analysis of differentially expressed genes in siblings and tnfaip1 mutants.