IMAGE

Figure 2

ID
ZDB-IMAGE-230330-20
Genes
Source
Figures for Sobah et al., 2023
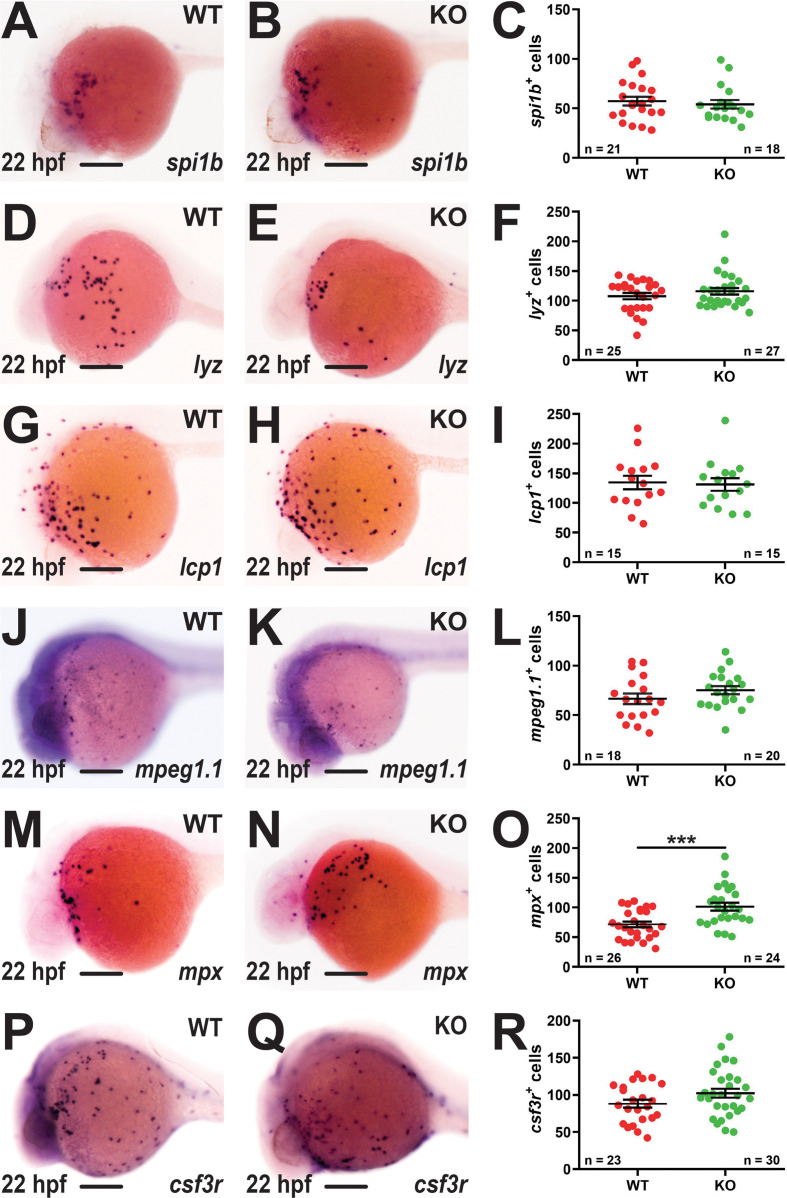
Image
Figure Caption

Figure 2

Effect of socs3b ablation on primitive hematopoiesis. Representative images of wildtype (WT, socs3bwt/wt) and knockout (KO, socs3bmdu24/mdu24) embryos subjected to WISH using spi1b(A, B), lyz(D, E), lcp1(G, H), mpeg1.1(J, K), mpx(M, N) and csf3r(P, Q) at 22 hpf, showing the major areas of staining in each case, with scale bars representing 200 μm. Quantitation of spi1b+(C), lyz+(F), lcp1+(I), mpeg1.1+(L), mpx+(O) and csf3r+(R) cells showing numbers in individual embryos along with mean and standard error of the mean (SEM), with statistical significance indicated. Student t-tests were used to measure the significance between WT and KO samples with Welch’s correction performed if required (*** p < 0.001).

Figure Data
Acknowledgments
This image is the copyrighted work of the attributed author or publisher, and ZFIN has permission only to display this image to its users. Additional permissions should be obtained from the applicable author or publisher of the image. Full text @ Front Immunol