
|
Fig. 7
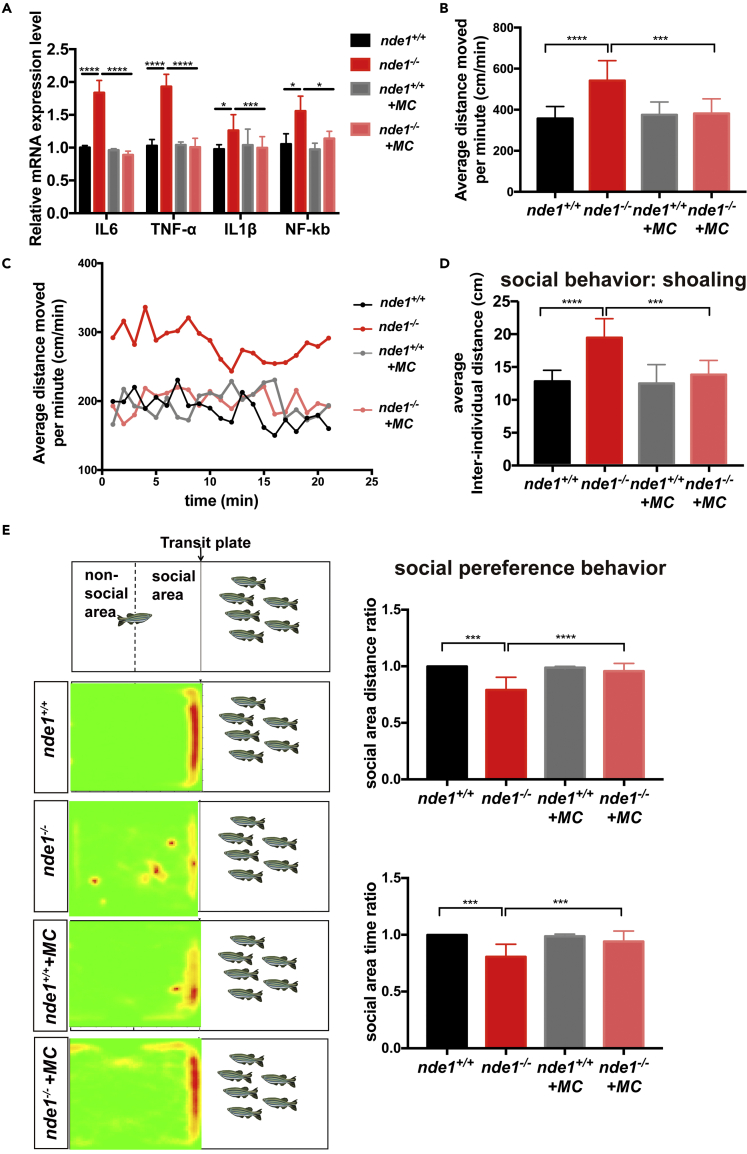
Analysis of brain inflammatory response and behavior of minocycline treated zebrafish
(A) Relative expression level of IL-6, TNF-α, IL-1β, and NF-kb in nde1+/+, nde1−/−, and minocycline-treated zebrafish.
(B and C) Locomotor activity (B) and movement trend graph (C) of 3.5 mpf nde1+/+, nde1−/−, nde1+/+ treated with MC, and nde1−/− treated with MC, n = 12.
(D) Inter-fish distance of four groups of zebrafish in shoaling behavior analysis (n = 10).
(E) Schematic and representative heatmap of social preference test.
Time ratio and distance ratio in the social area were displayed (n = 10). ∗p < 0.05, ∗∗p < 0.01, ∗∗∗p < 0.001, ∗∗∗∗p < 0.0001. Data are presented as mean ± SEM