IMAGE

Figure 7

ID
ZDB-IMAGE-221020-91
Genes
Source
Figures for Liu et al., 2022
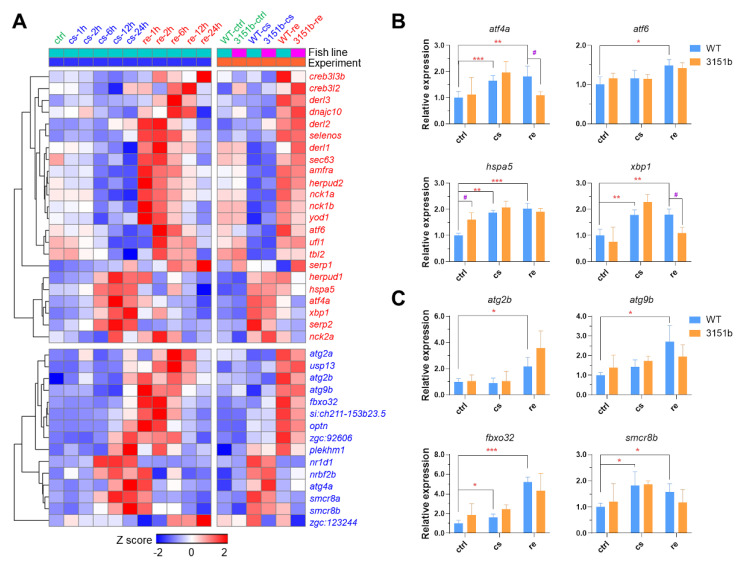
Image
Figure Caption

Figure 7

Effects of Tmem39b dysfunction on endoplasmic reticulum stress response and autophagy. (A) A complex heatmap indicating the transcriptional expression of genes involved in endoplasmic reticulum stress response (red) and autophagy (blue). The genes were up-regulated at certain time points upon cold exposure or recovery under a normal temperature. The left part of the heatmap indicates the results of a previous study and the right part displays the data of this study. The rows of the heatmap represent genes and the columns show the averaged expression of the genes during different conditions. The row Z scores are calculated separately for the two experiments. Expression of representative genes involved in ER stress response (B) and autophagy (C) are determined by qPCR. *, p ≤ 0.05; **, p ≤ 0.01; ***, p ≤ 0.001; #, p ≤ 0.05 (n = 4). “#” indicates significant difference in gene expression between WT and zko3151b under the same condition.

Figure Data
Acknowledgments
This image is the copyrighted work of the attributed author or publisher, and ZFIN has permission only to display this image to its users. Additional permissions should be obtained from the applicable author or publisher of the image. Full text @ Int. J. Mol. Sci.