
Fig. 2
- ID
- ZDB-IMAGE-220920-67
- Genes
- Publication
- Tian et al., 2022 - WRN promotes bone development and growth by unwinding SHOX-G-quadruplexes via its helicase activity in Werner Syndrome
- All Figures
- Figures for Tian et al., 2022
|
Fig. 2
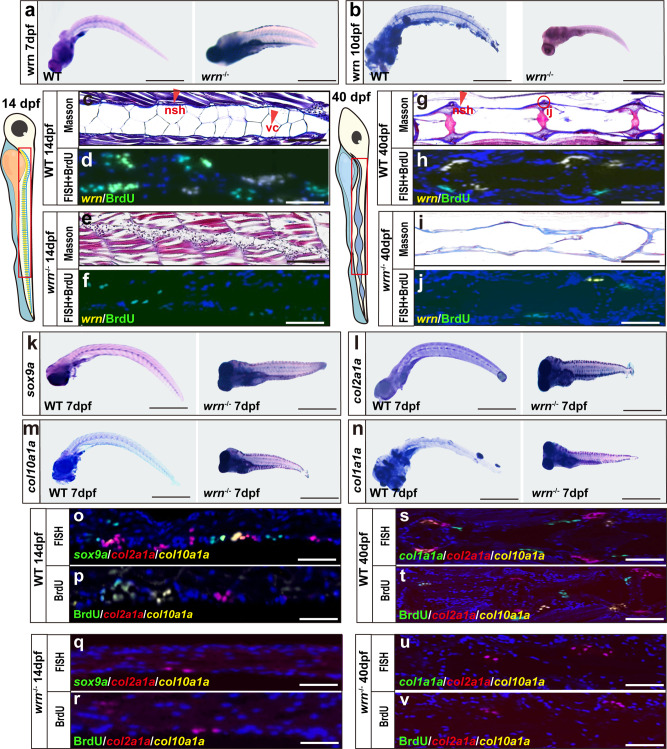
a, b Representative WISH analysis of 3 independent experiments of wrn expression between WT and wrn−/− mutant zebrafish on both 7 dpf and 10 dpf. c, e, g, i Representative Masson’s trichrome staining of 3 independent experiments between WT and wrn−/− mutant zebrafish on 14 dpf (c WT; e wrn−/− mutants) and 40 dpf (g WT; i, wrn−/− mutants). Scale bar = 100 µm. Notochord sheath (nsh, red arrow indicated) and notochord vaculated cells (vc, red arrow indicated). Intercentral joint (ij, red encircled) and centrum (ct). d, h, f, j Representative FISH analysis of 3 independent experiments of wrn expression and BrdU staining between WT and wrn−/− mutant zebrafish on 14 dpf (d WT; f wrn−/− mutants) and 40 dpf (h WT; j wrn−/− mutants). k–n Representative WISH analysis of 3 independent experiments of chondrogenic markers (sox9a, col2a1a, col10a1a, and col1a1a) between WT and wrn−/− mutant zebrafish on 7 dpf. Scale bar = 50 µm. o–v Representative FISH analysis combined with BrdU staining of 3 independent experiments of chondrogenic markers (sox9a, col2a1a, and col10a1a) between WT and wrn−/− mutant zebrafish on 14 dpf (o, p WT; q, r wrn−/− mutants) and chondrogenic markers (col2a1a, col10a1a, and col1a1a) on 40 dpf (s, t WT; u, v wrn−/− mutants). Scale bar = 100 µm.