
Figure 6
- ID
- ZDB-IMAGE-220416-60
- Genes
- Publication
- Huang et al., 2022 - Negative Elongation Factor (NELF) Inhibits Premature Granulocytic Development in Zebrafish
- All Figures
- Figures for Huang et al., 2022
|
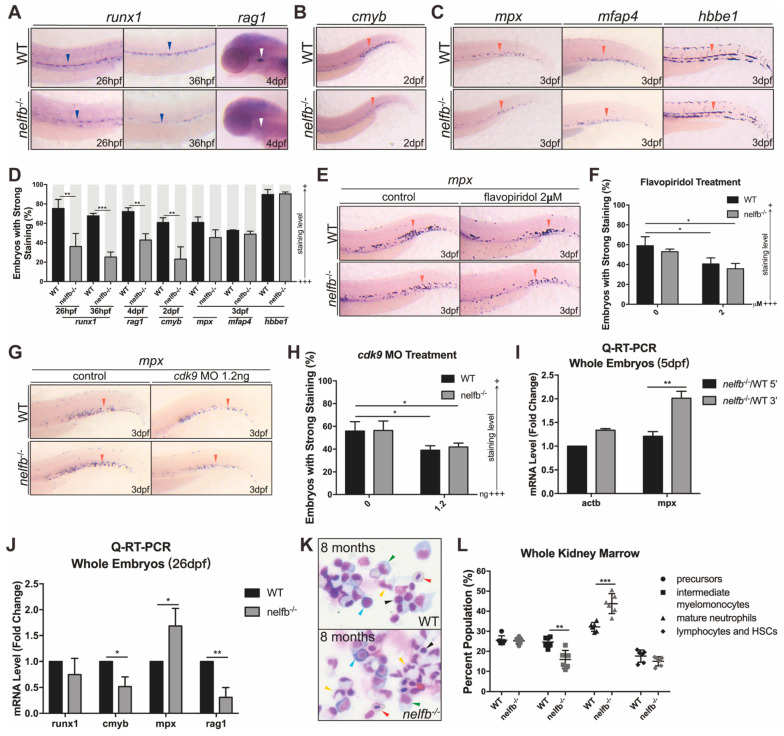
Figure 6 Granulocytic differentiation at late developmental stages and in adulthood also shows defects in nelfb−/− zebrafish. (A) WISH for runx1 or rag1 in WT and nelfb−/− embryos at 26 hpf and 4 dpf. (B) WISH for cmyb in WT and nelfb−/− embryos at 2 dpf. (C) WISH for mpx, mfap4, and hbbe1 in WT and nelfb−/− embryos at 3 dpf. Blue arrowheads, white arrowheads, and red arrowheads, respectively, indicate AGM region, thymus, and CHT. (D) Quantification of WISH results in (A–C) (n = 30–40 embryos per group). (E) WISH for mpx at 3 dpf in WT and nelfb−/− embryos treated with flavopiridol. (F) Quantification of WISH results in (E) (n = 20–30 embryos per group). (G) WISH for mpx at 3 dpf in WT and nelfb−/− embryos injected with 1.2 ng cdk9 MO. (H) Quantification of WISH results in (H) (n = 20–30 embryos per group). (I) Q-RT-PCR analysis of 5′ and 3′ transcripts of mpx gene in WT and nelfb−/− embryos at 5 dpf. Gene expression is normalized to the 5′ transcript of β-actin and shown as fold-change relative to WT. (J) Q-RT-PCR analysis of hematopoiesis-related genes in WT and nelfb−/− mutant fish at 26 dpf. Gene expression is normalized to β-actin and presented as fold-change relative to WT. (K) May–Grünwald–Giemsa staining of WKM from WT and nelfb−/− fish at 8 mpf. Blue arrowheads, precursors; green arrowheads, intermediate myelomonocytes; yellow arrowheads, mature neutrophils; black arrowheads, lymphocytes and HSCs; red arrowheads, erythrocytes. (L) Quantification of WKM staining results. All results are presented as the mean ± SD from a representative of three independent experiments (t test, * for p < 0.05, ** for p < 0.01, *** for p < 0.001). “+++” and “+” in (D,F,H) respectively represent strong staining and weak staining. Note: dpf, days post-fertilization; mpf, months post-fertilization; AGM region, aorta-gonad-mesonephros region; CHT, caudal hematopoietic tissue; WKM, whole kidney marrow; HSCs, hematopoietic stem cells.