
Figure 7
- ID
- ZDB-IMAGE-210902-197
- Genes
- Publication
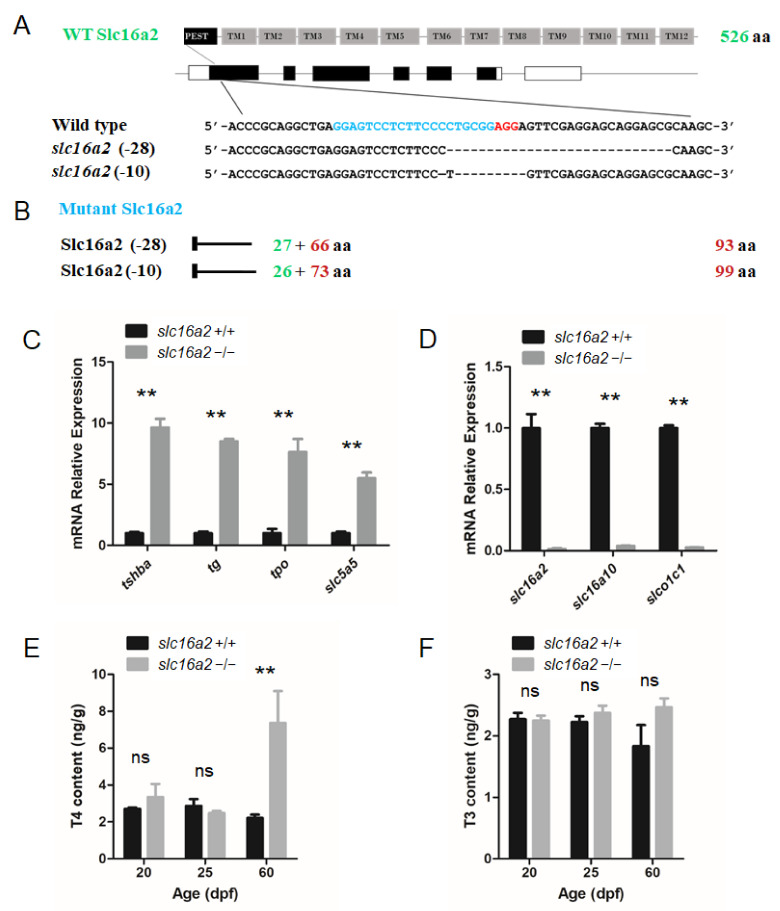
- Song et al., 2021 - Functions of the Thyroid-Stimulating Hormone on Key Developmental Features Revealed in a Series of Zebrafish Dyshormonogenesis Models
- All Figures
- Figures for Song et al., 2021
|
Figure 7
Generation of the