
IMAGE
Figure 3
- ID
- ZDB-IMAGE-210216-34
- Genes
- Publication
- Li et al., 2021 - Pcgf1 Regulates Early Neural Tube Development Through Histone Methylation in Zebrafish
- All Figures
- Figures for Li et al., 2021
Image
|
Figure Caption
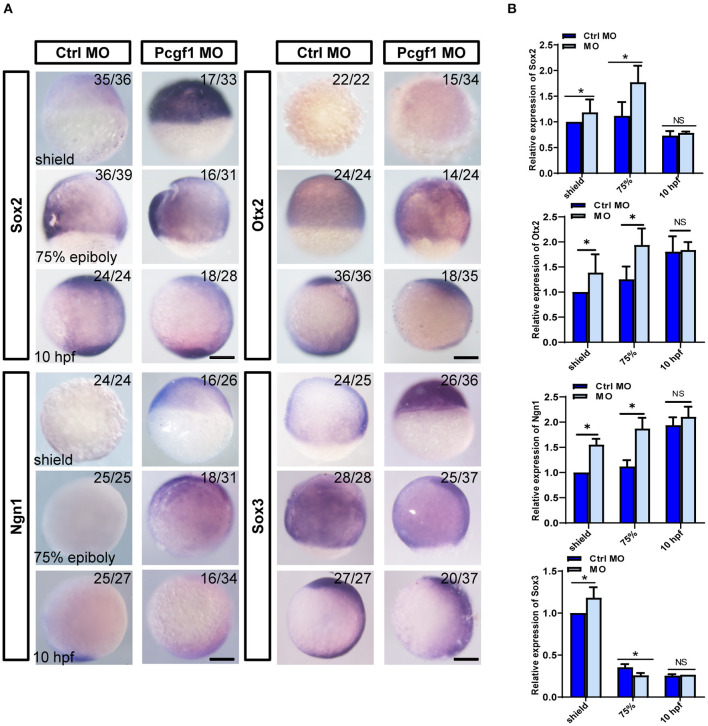
Figure 3 Effect of Pcgf1 on neural induction phase. (A) The expression levels of Sox2, Otx2, Ngn1, and Sox3 were detected by whole-mount in situ hybridization at neural induction phase (shield phase, 75% epiboly phase, and 10 hpf). Scale bar: 200 μm. (B) The expression of Sox2, Otx2, Ngn1, and Sox3 was analyzed by qPCR, and the expression of β-actin gene represented internal controls. Data represent the mean of at least three independent experiments ± SEM, *P < 0.05 vs. control MO.
Figure Data
Acknowledgments
This image is the copyrighted work of the attributed author or publisher, and
ZFIN has permission only to display this image to its users.
Additional permissions should be obtained from the applicable author or publisher of the image.
Full text @ Front Cell Dev Biol