
Fig. 1
- ID
- ZDB-IMAGE-190923-7
- Genes
- Antibodies
- Publication
- Chambers et al., 2019 - Tfap2a is a novel gatekeeper of nephron differentiation during kidney development
- All Figures
- Figures for Chambers et al., 2019
|
Fig. 1
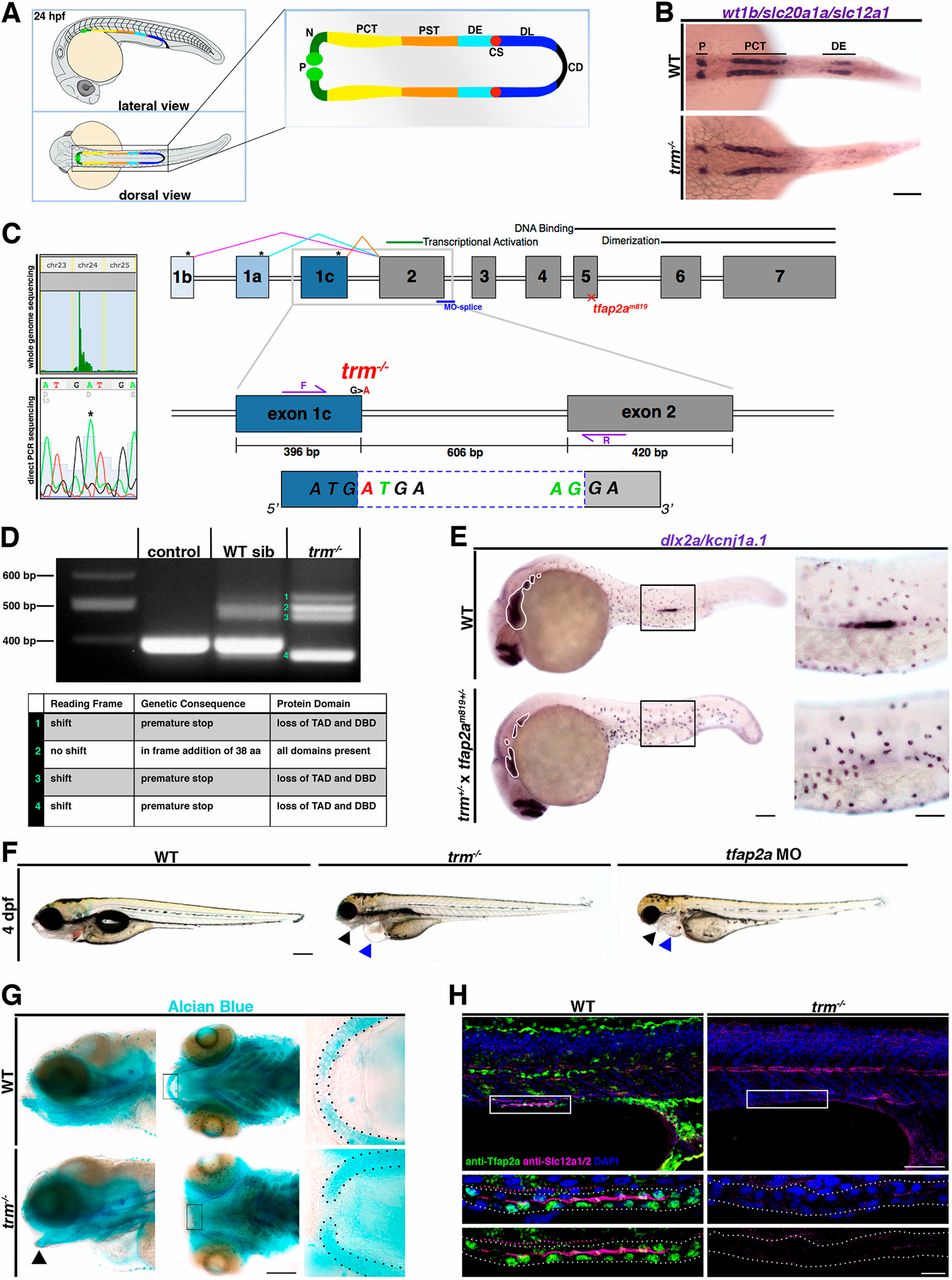
Forward genetic screen reveals tfap2a is necessary for nephrogenesis in the developing zebrafish pronephros. (A) Zebrafish pronephros schematic. P, podocytes; N, neck; PCT, proximal convoluted tubule; PST, proximal straight tubule; DE, distal early; CS, corpuscle of Stannius; DL, distal late; CD, collecting duct. (B) Whole-mount in situ hybridization at 24 hpf. Scale bar: 70 µm. (C) SNPtrack from whole-genome sequencing at chromosome 24, with G>A tfap2a mutation in trm−/−. Exon diagram: tfap2a spliceoforms (pink, cyan and orange); black asterisks indicate alternative start sites; location of MO (blue) and tfap2am819 lesion (red); conserved nucleotides (green), mutant nucleotides (red) and primer locations (purple). (D) RT-PCR with mutant bands 1-4 (green) and table of predicted consequences from sequence analysis. TAD, transcriptional activation domain; DBD, DNA-binding domain. (E) Whole-mount in situ hybridization with pharyngeal arches (white outlines) and DE (black box) indicated. Scale bars: 70 µm (left) and 35 µm (right). (F) trm mutants exhibit abnormal craniofacial cartilage (black arrowheads) and pericardial edema (blue arrowheads). Scale bar: 200 µm. (G) Alcian Blue staining, with gaping jaw (black arrowhead); black dotted lines trace Meckel's cartilage. Scale bar: 100 µm. (H) Immunofluorescence of Tfap2a (green) and Slc12a1/2 (magenta). White dots show the pronephros border. Scale bars: 50 µm (top), 10 µm (bottom).