
Fig. 6
- ID
- ZDB-IMAGE-190923-12
- Genes
- Publication
- Chambers et al., 2019 - Tfap2a is a novel gatekeeper of nephron differentiation during kidney development
- All Figures
- Figures for Chambers et al., 2019
|
Fig. 6
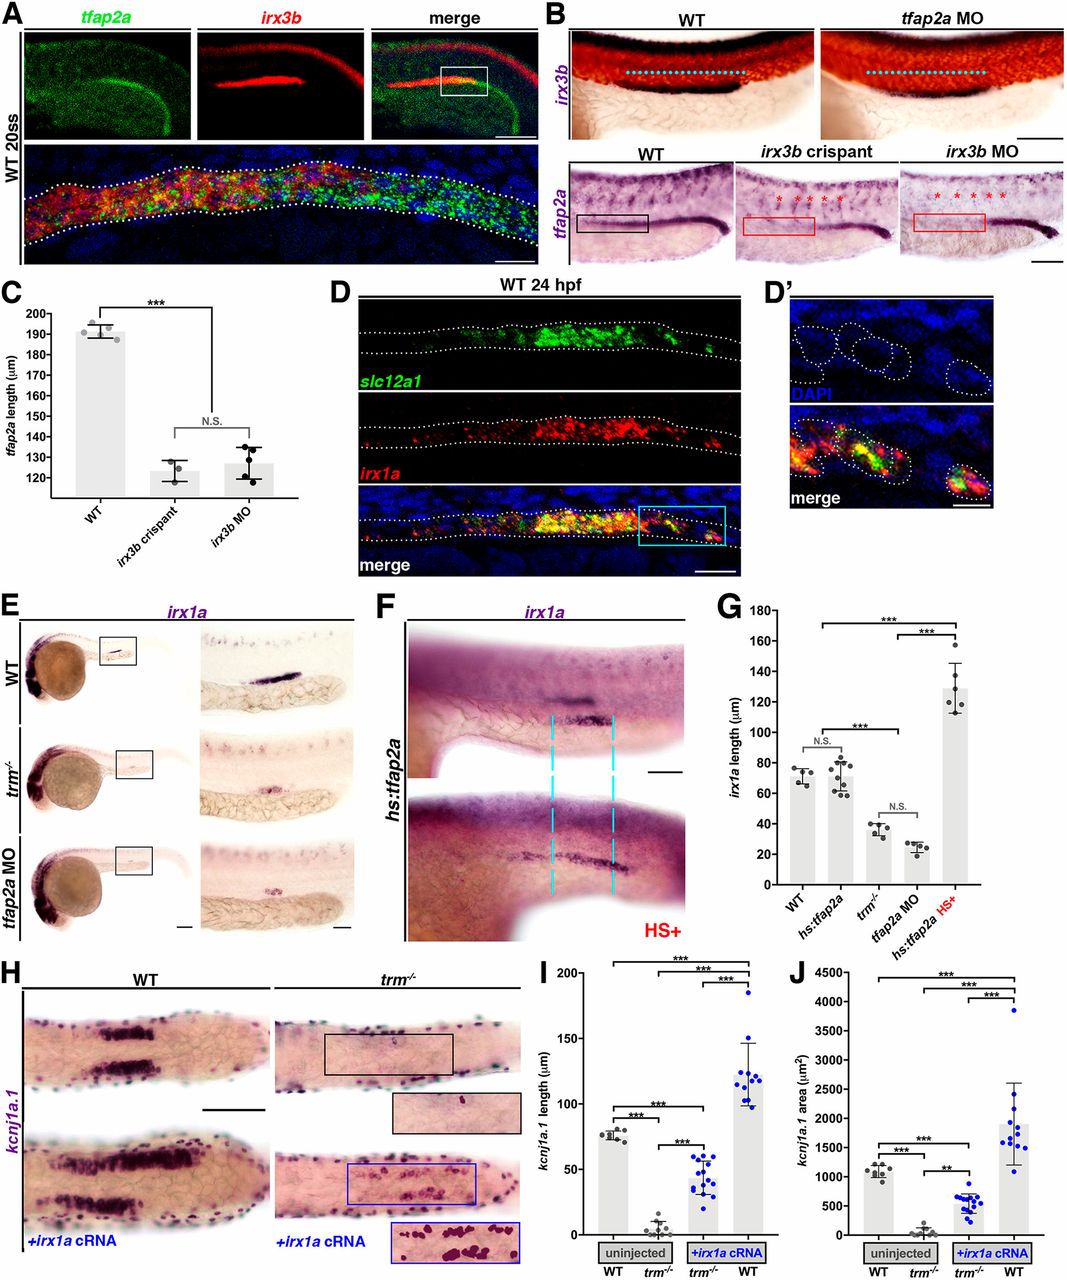
tfap2a interplays with the Iroquois homeobox genes irx3b and irx1a during nephrogenesis. (A) Fluorescent in situ hybridization for indicated markers. White box indicates the area shown in the panel below. Scale bars: 70 µm (top) and 10 µm (bottom). (B) Whole-mount in situ hybridization for indicated markers. Cyan dots indicate the irx3b expression domain. Black box indicates the presence of tfap2a transcripts; the red box indicates their absence. Red asterisks indicate disrupted tfap2a expression in neural crest streams. Scale bars: 70 µm. (C) tfap2a expression domain quantification (n≥3). Measurements compared by unpaired t-test. Data are mean±s.d. ***P<0.001. (D) Fluorescent in situ hybridization for indicated markers. Cyan box indicates the region shown in D′. Scale bar: 10 µm. (D′) Optical zoom to highlight the area of interest; DAPI (top); merge (bottom); dotted lines encircle dually expressing slc12a1+ irx1a+ cells. Scale bar: 5 µm. (E,F,H) Whole-mount in situ hybridization for indicated markers. Scale bars: 75 µm in E; 35 µm in F. (G,I) Domain length quantifications. (H) Insets show trace of kcnj1a.1+ (solid purple) for area quantifications in J. Scale bar: 75 µm. (J) kcnj1a.1 area quantification per nephron. Measurements compared using ANOVA. Data are mean±s.d. **P<0.01; ***P<0.001; N.S., not significant.