
Fig. S4
- ID
- ZDB-IMAGE-190328-14
- Genes
- Publication
- Boyle Anderson et al., 2018 - A transcriptomics analysis of the Tbx5 paralogues in zebrafish
- All Figures
- Figures for Boyle Anderson et al., 2018
|
Fig. S4
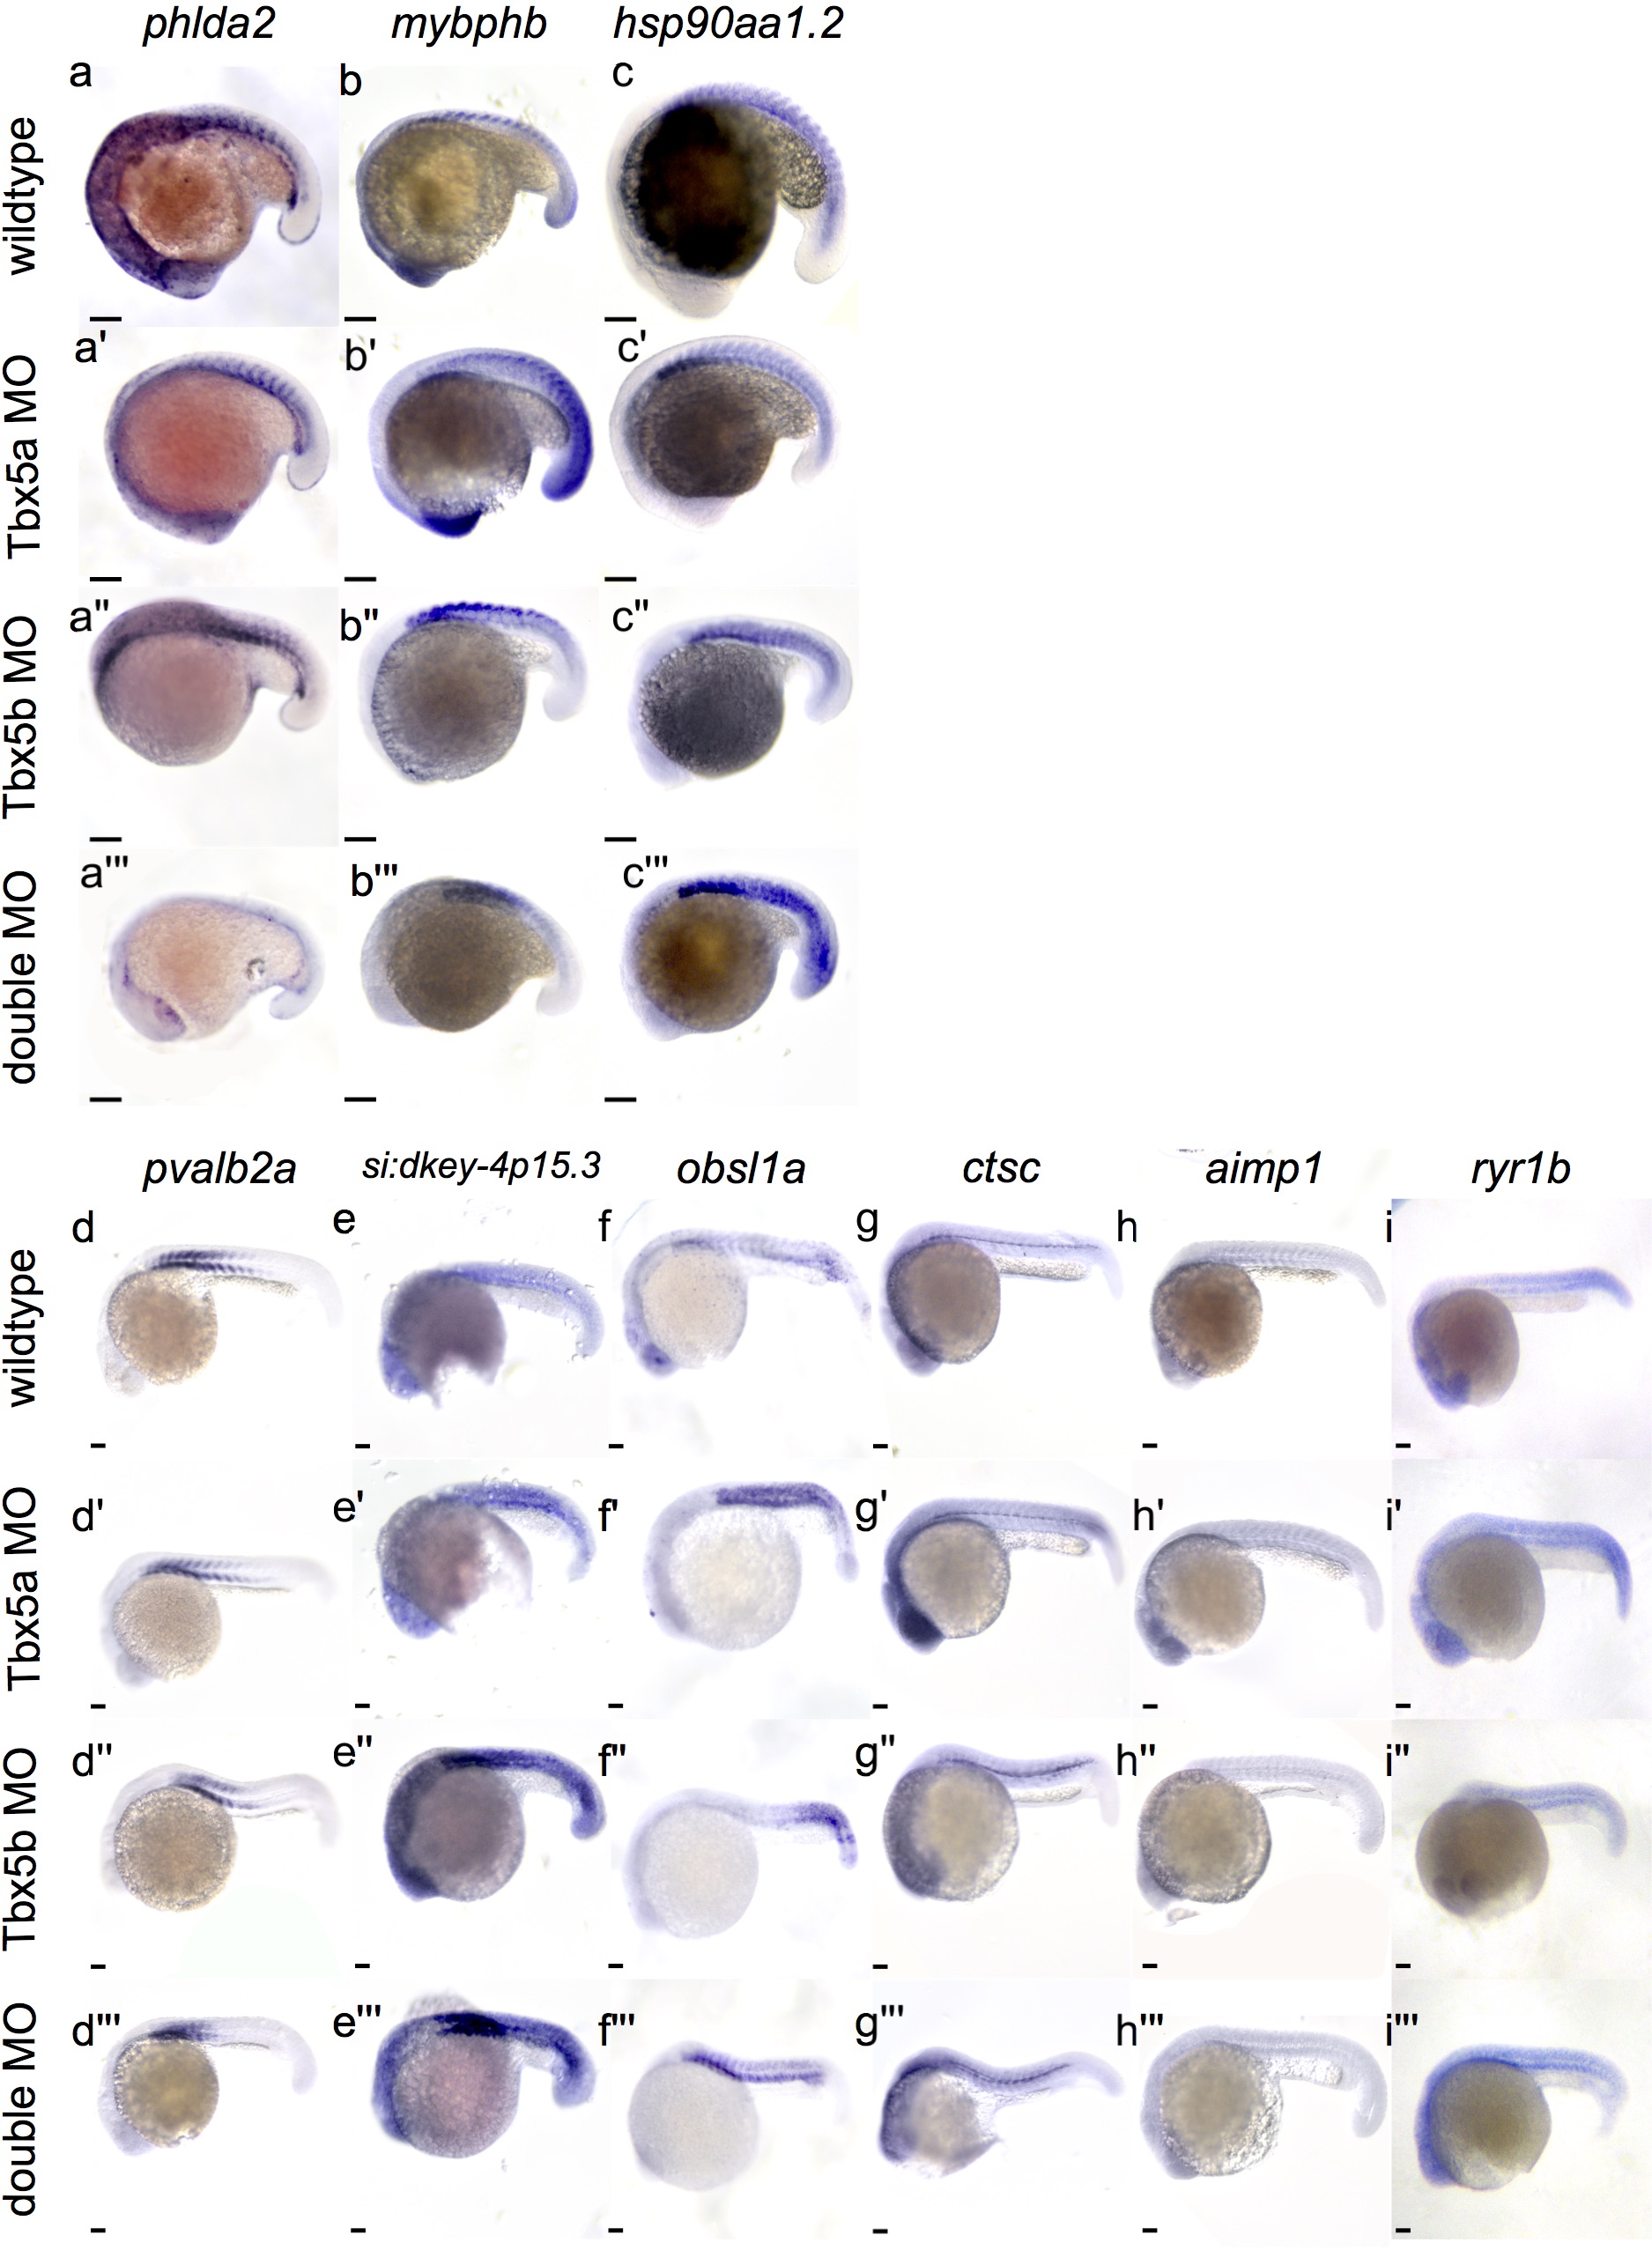
Complete somite differential expression.
In situ hybridization of all genes differentially expressed in the somites. (a-a”’) At 18hpf, phlda2 is upregulated in Tbx5a-deficient (a’) and Tbx5b-deficient (a”) embryos compared to wildtype embryos (a’), but downregulated in the double-deficient embryos (a”’). At 18hpf, mybphb shows upregulation in Tbx5a-deficent (b’) and double-deficient (b”’) embryos compared to wildtype embryos (b). At 18hpf, hsp90aa1.2 is upregulated in Tbx5a-deficient (c’), Tbx5b-deficient (c”) and double-deficient (c”’) embryos compared to wildtype (c) embryos, especially in the anterior somites. At 21 hpf, pvalb2 expression is increased in Tbx5b-deficient (d”) and double-deficient (d”’) embryos compared to wildtype (d) but not Tbx5a-deficient embryos (d’). At 21 hpf, si:dkey-4p:15.3 expression is increased in Tbx5a-deficient (e’), Tbx5b-deficient (e”) and double-deficient (e”’) embryos. At 21 hpf, obsl1a expression is upregulated in Tbx5a-deficient (f’), Tbx5b-deficient (f”) and double-deficient (f”’) embryos compared to wildtype (f) embryos. At 21 hpf, ctsc expression is expanded in Tbx5a-deficient (g’) and Tbx5b-deficient (g”) embryos compared to wildtype (g) embryos. At 21 hpf, aimp1 expression is decreased in Tbx5a-deficient (h’), Tbx5b-deficient (h”) and double-deficient (h”’) embryos compared to wildtype embryos (h). At 21 hpf, ryr1b expression is increased in both Tbx5a-deficient (i’) and double-deficient (i”’) embryos compared to wildtype (i) embryos. (j-k) Comparison of length between Tbx5b mutant embryos and siblings, n = 10, measurements in μm. (j) Tbx5b-deficient embryos at 3 dpf are significantly shorter than their siblings. (k) Somite size is not significantly different at 3dpf between Tbx5b-deficient embryos and their wildtype siblings. Since somite size varies along the AP axis, measurements were taken of the more anterior somites only. (l) At 25 hpf, there is a significant difference in somite number between wildtype and Tbx5b morpholino injected embryos. Scale bar is 100 μm.