
Fig. 1
|
Fig. 1
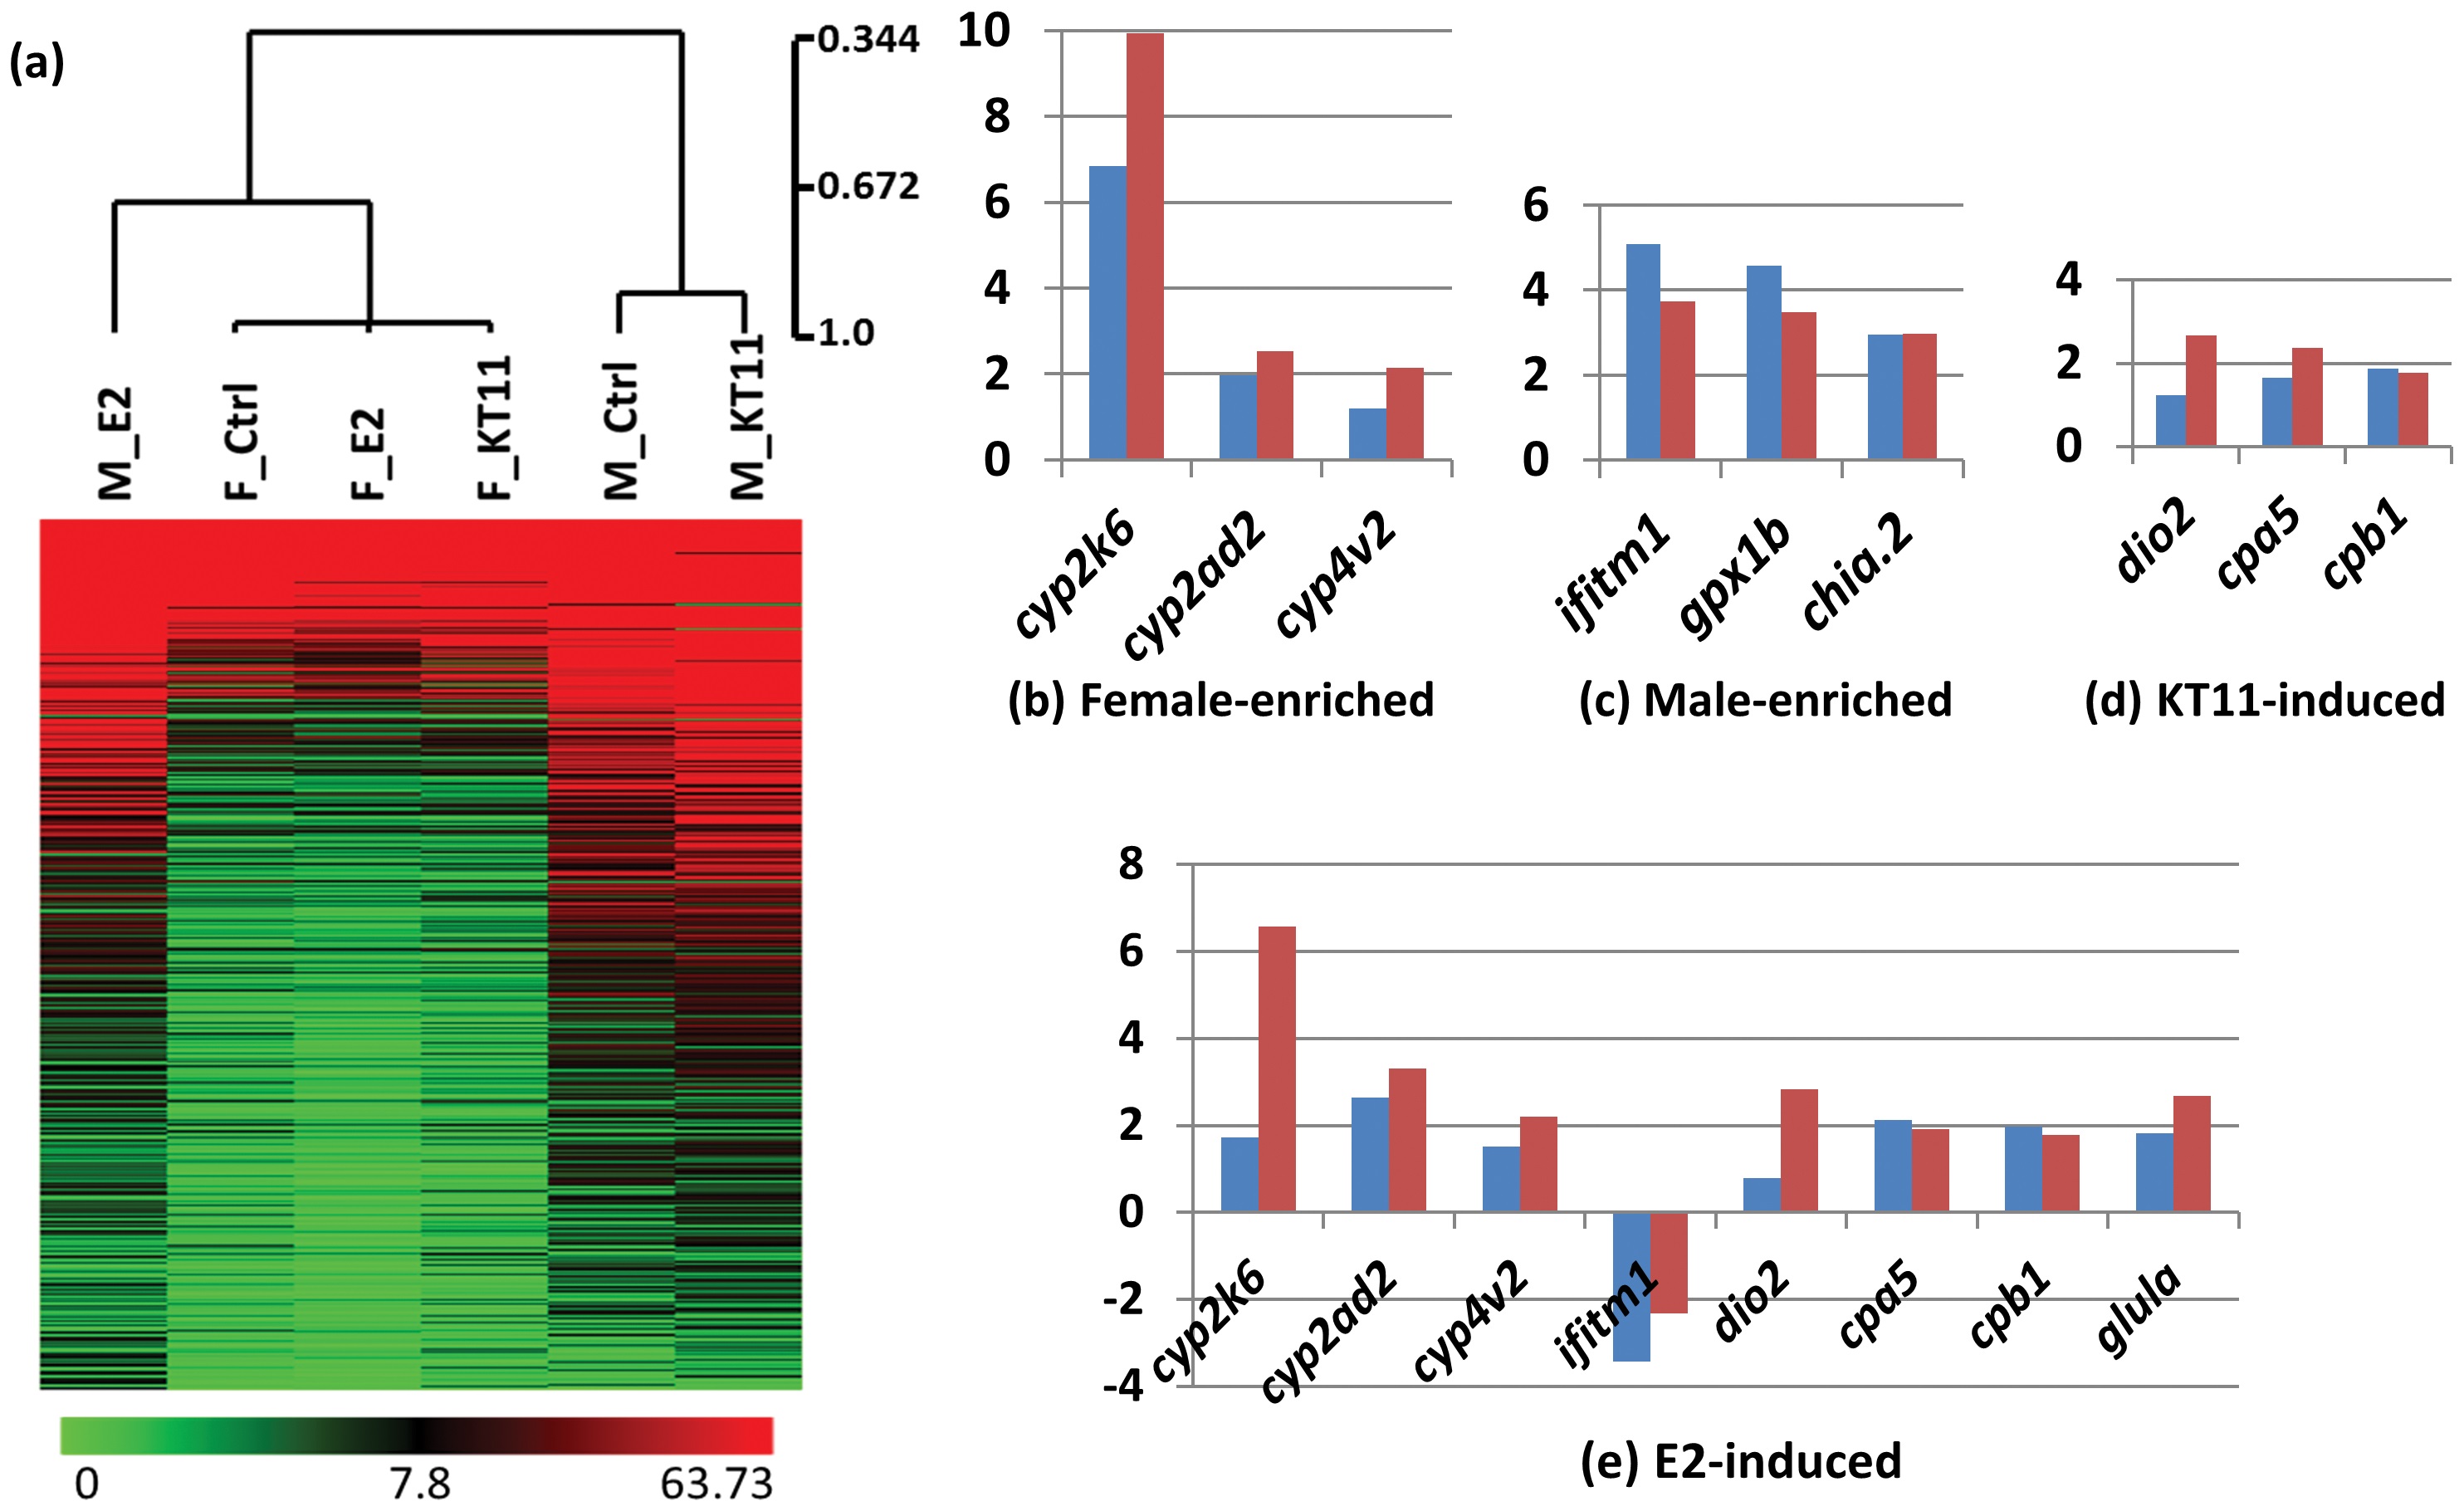
Hierarchical clustering of the six liver transcriptomes and real-time RT-PCR validation of RNA expression of selected genes.
(a) Hierarchical clustering of the six liver transcriptomes from control males and females, E2-treated males and females, and KT11-treated males and females. The three female samples were closely clustered together, and E2-treated males was clustered with the female samples. Control males and KT11-treated males were clustered together and were distinct from the others. Scale bar represented the pearson correlation score. Heatmap was constructed with transcripts that showed significant differences in at least one comparison. (b-e) Real-time RT-PCR validation of transcripts enriched in the female liver (b), male liver (c), induced by KT11 (d) or E2 (e) in male livers. Fold changes (log2 base) measured by real-time RT-PCR (blue bars) are compared with those measured by RNA-SAGE sequencing (red bars).