
Fig. 1
- ID
- ZDB-IMAGE-160824-18
- Genes
- Publication
- Huang et al., 2016 - The circadian clock regulates autophagy directly through the nuclear hormone receptor Nr1d1/Rev-erbα and indirectly via Cebpb/(C/ebpβ) in zebrafish
- All Figures
- Figures for Huang et al., 2016
|
Fig. 1
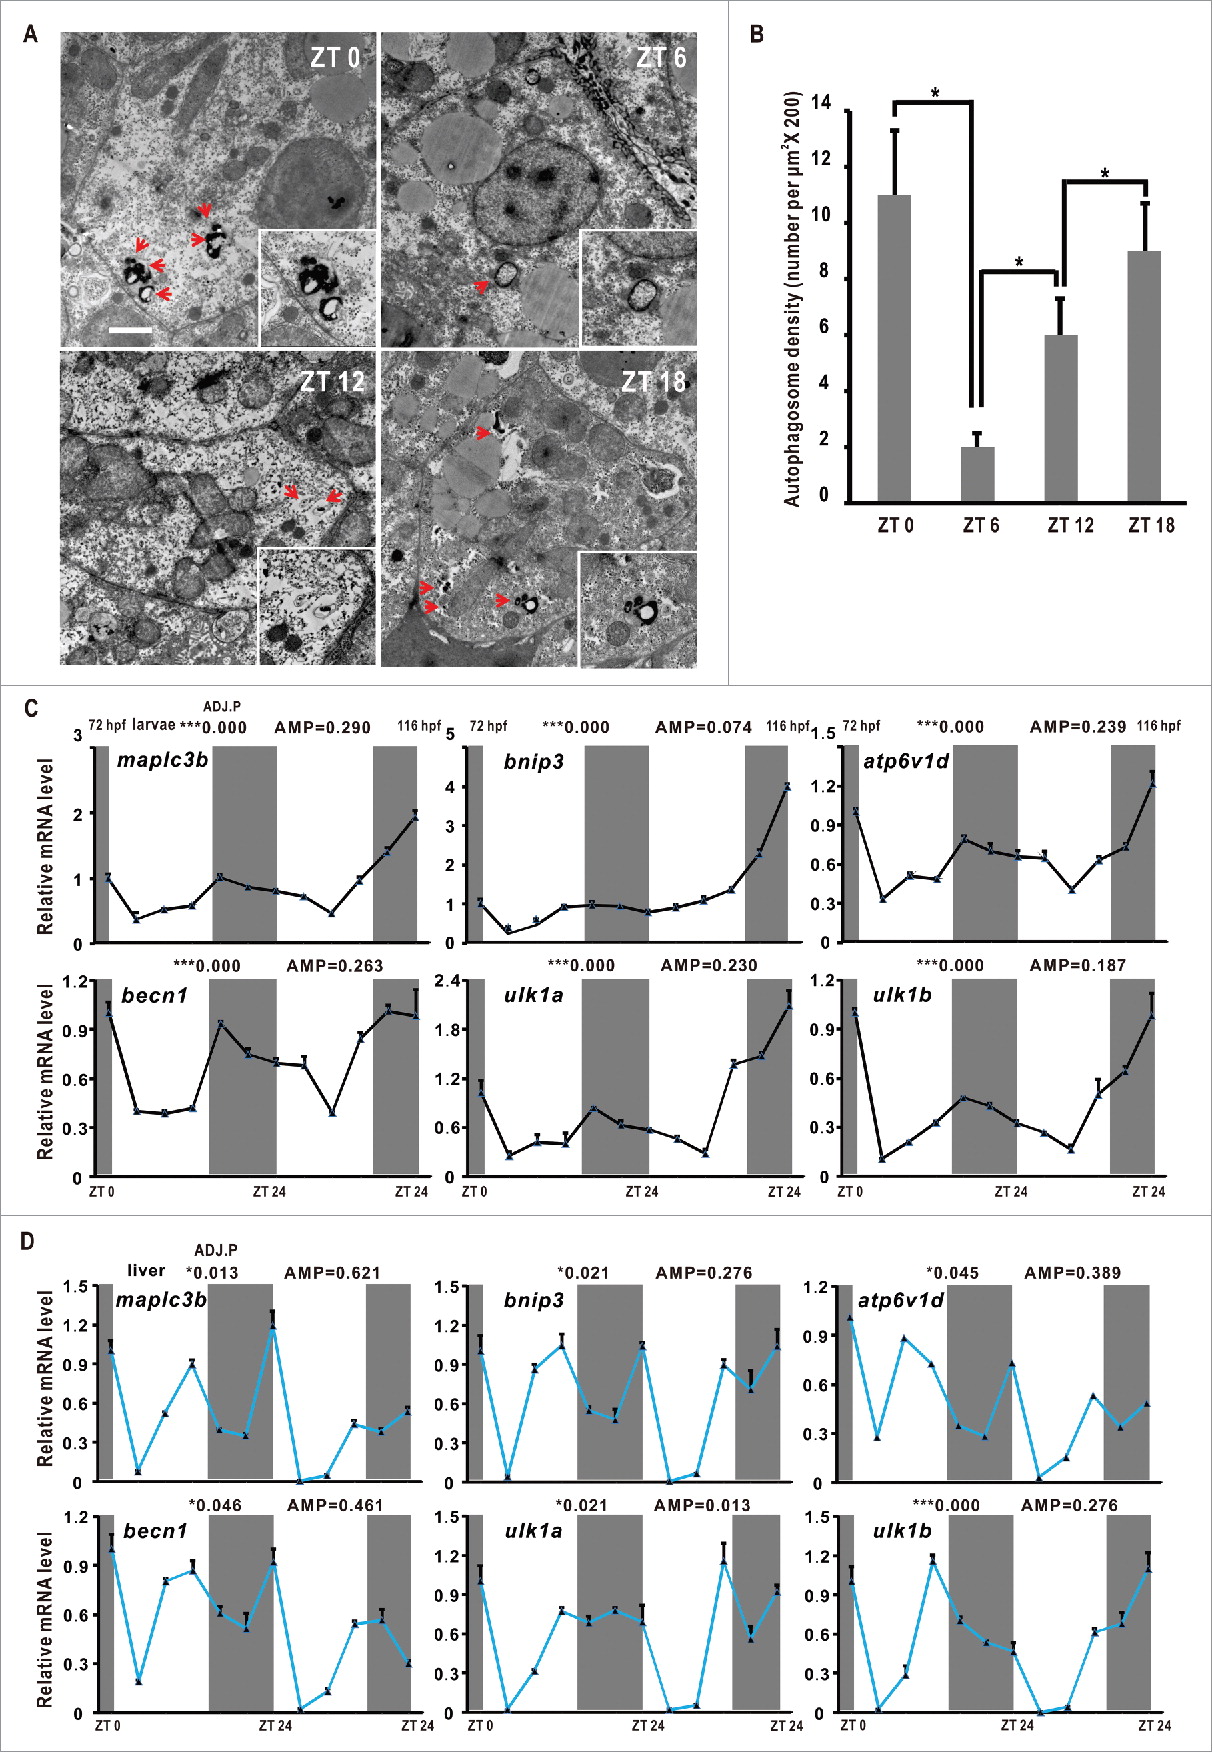
Autophagy rhythms in zebrafish. (A) Transmission electron micrograph of the zebrafish liver sections at ZT 0, ZT 6, ZT 12 and ZT 18. The scale bar in the bottom left corner of ZT 0 panel represents one micron. High magnification in the right low corners highlights a cytosolic region. Note the presence of double-membrane autophagosomes and autolysosomes (red arrowhead). (B) Quantification of autophagosome and autolysosome abundance in (A). Data represent mean ± s.e. **, P ≤ 0.01. The Student t test was conducted. (C) RT-PCR analysis of expression of map1lc3b, bnip3, atp6v1d, becn1, ulk1a and ulk1b in zebrafish larvae from 72 hpf to 96 hpf. Zebrafish were maintained at 14 h light and 10 h dark condition. Approximately 50 zebrafish larvae were pooled for each time point. (D) RT-PCR analysis of expression of map1lc3b, bnip3, atp6v1d, becn1, ulk1a and ulk1b in zebrafish livers. Livers from 5 adult zebrafish were pooled for each time point. The mRNA expression levels were analyzed by the JTK-CYCLE method. ADJ.P for adjusted minimal P values (*, P ≤ 0 .05; ***, P ≤ 0 .001), AMP for amplitude. One-way ANOVA was conducted (***, P ≤ 0 .001). Data represent mean ± s.d. of the 3 independent experiments.