
Image
|
Figure Caption
Fig. 6
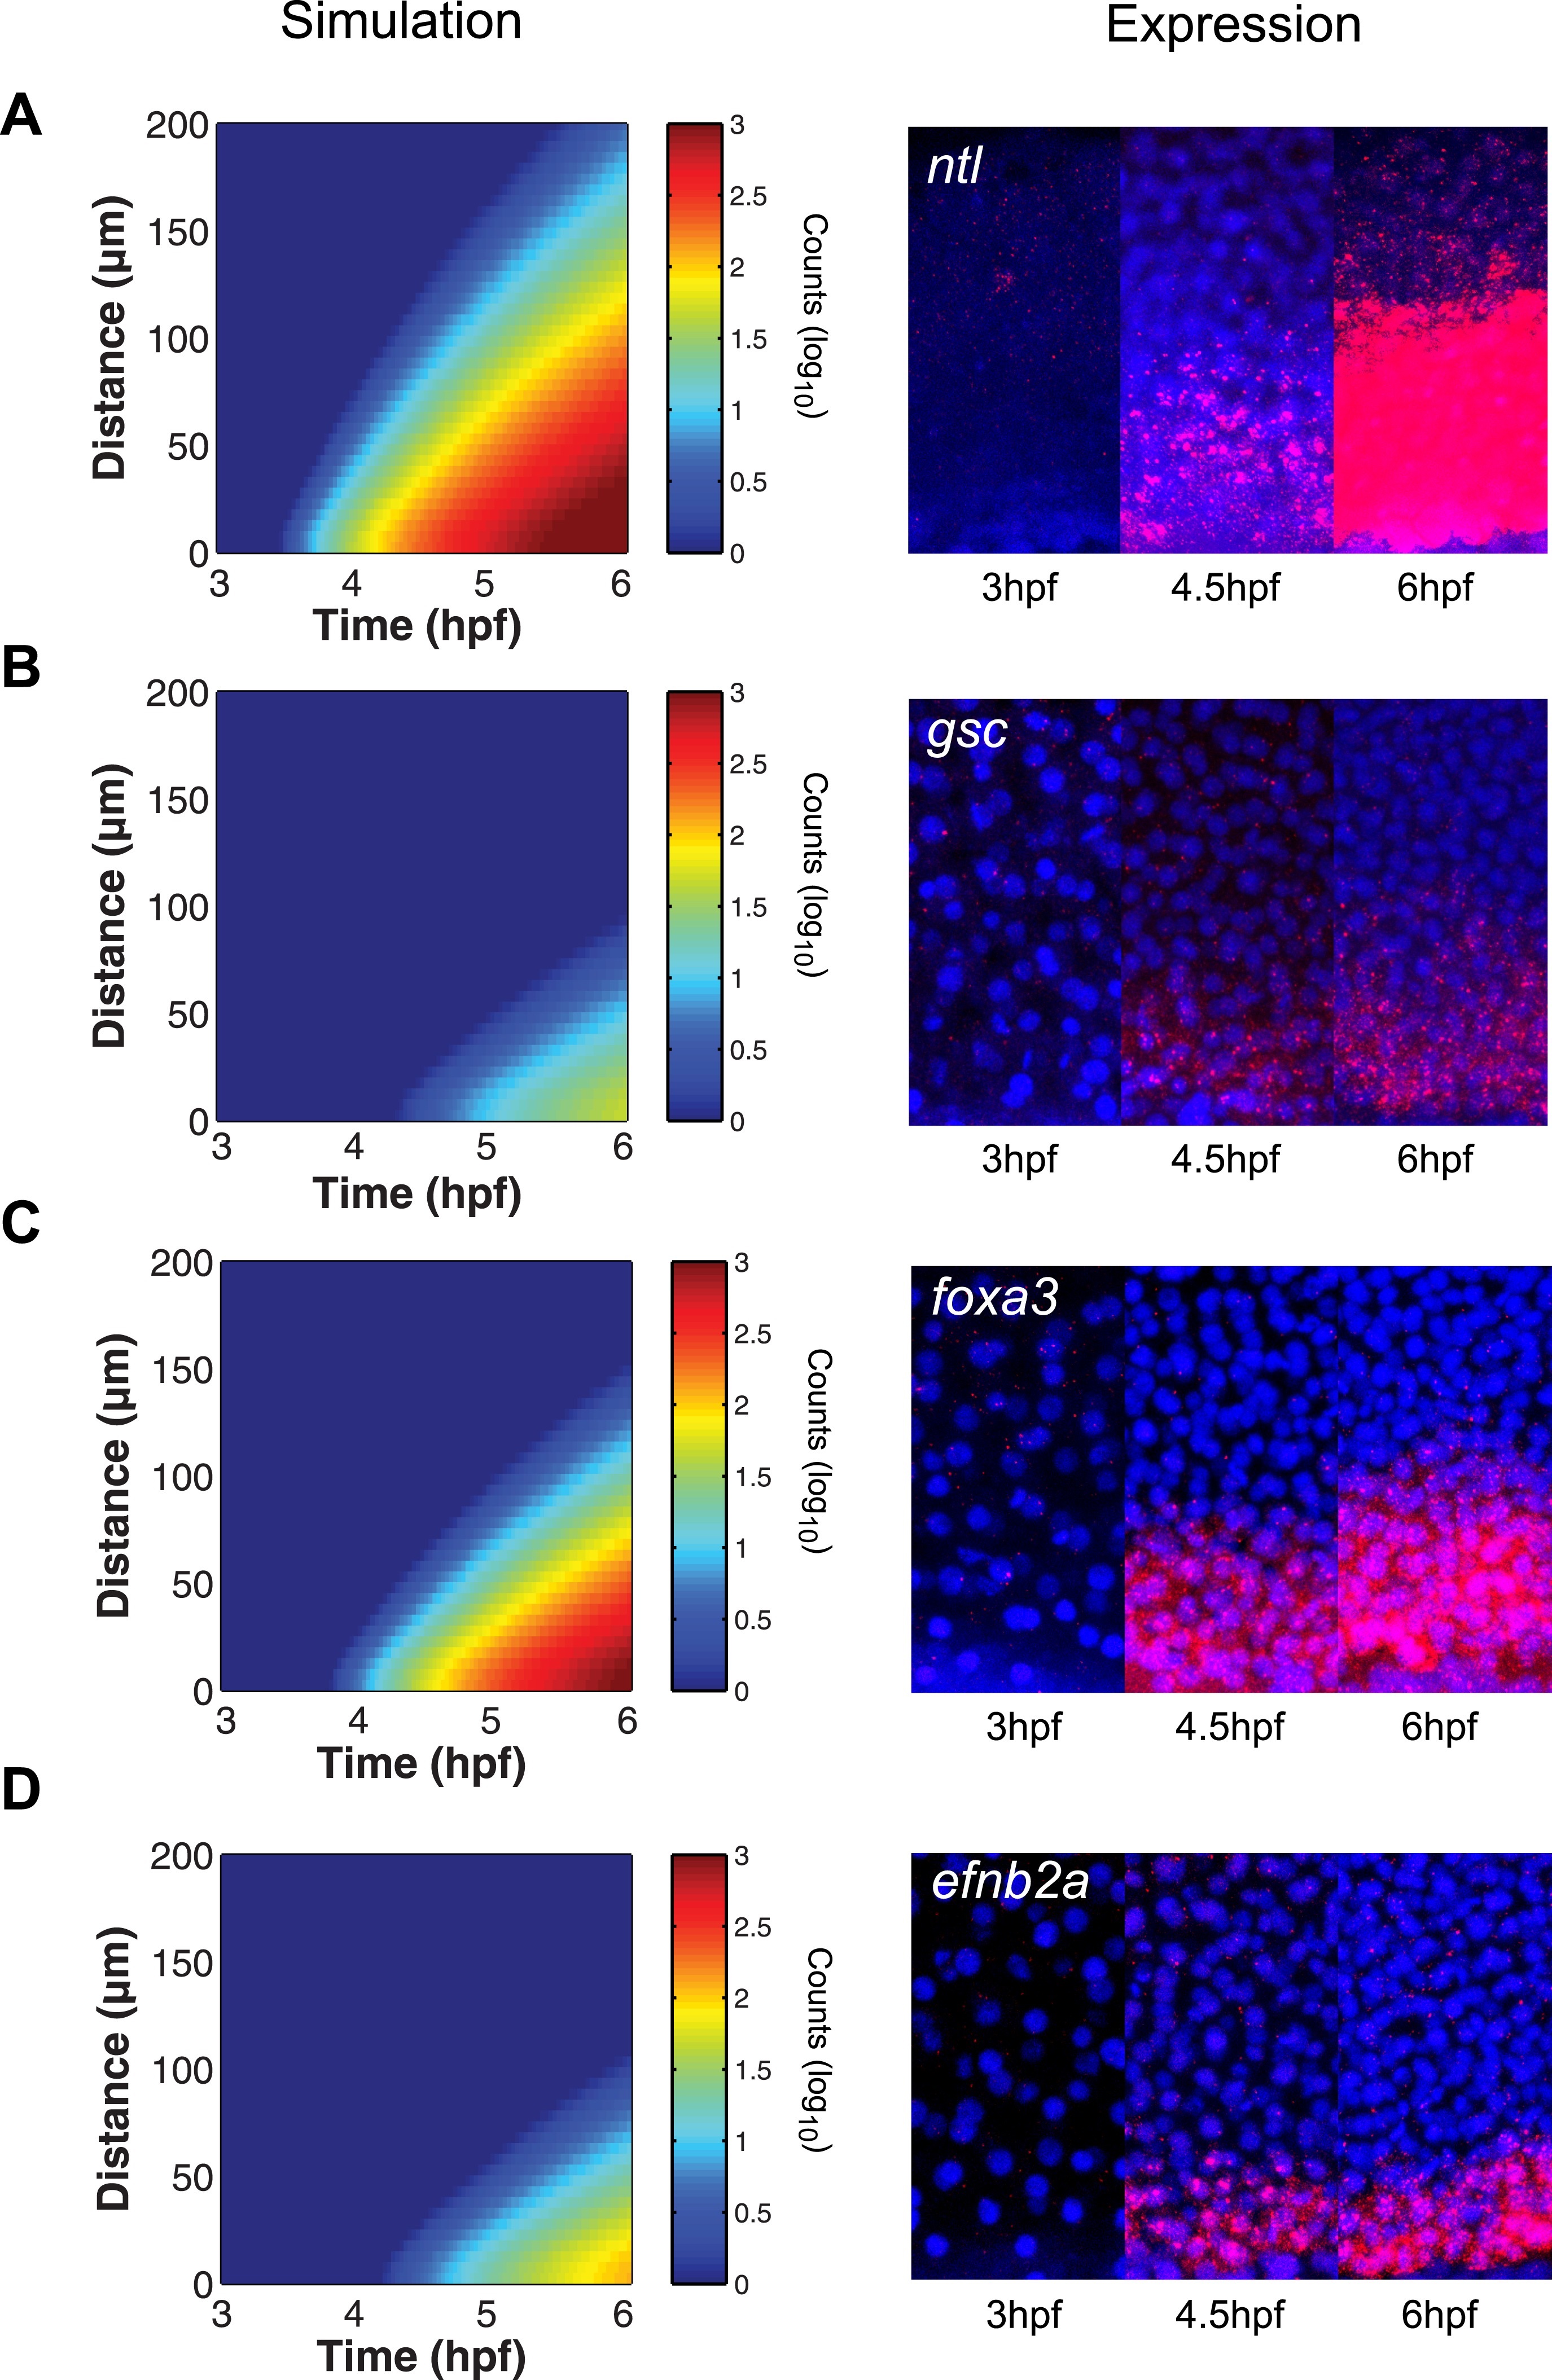
The kinetic model predicts gene expression patterns.
Comparison of kinetic model simulations and RNA fluorescent in situ hybridization for ntl (A), gsc (B), foxa3 (C), efnb2a (D). Left panels: simulations of spatiotemporal expression patterns over 3 hr along a 200 µm-high column of cells using gene-specific parameters identified in the parameter screen. Right panels: RNA fluorescent in situ hybridization at 3, 4.5 and 6 hpf. The size of the embryonic field is 100 µm wide and 200 µm high. Animal pole to the top.
Figure Data
Acknowledgments
This image is the copyrighted work of the attributed author or publisher, and
ZFIN has permission only to display this image to its users.
Additional permissions should be obtained from the applicable author or publisher of the image.
Full text @ Elife