
IMAGE
Fig. S4
- ID
- ZDB-IMAGE-160505-12
- Genes
- Publication
- Han et al., 2016 - Trim69 regulates zebrafish brain development by ap-1 pathway
- All Figures
- Figures for Han et al., 2016
Image
|
Figure Caption
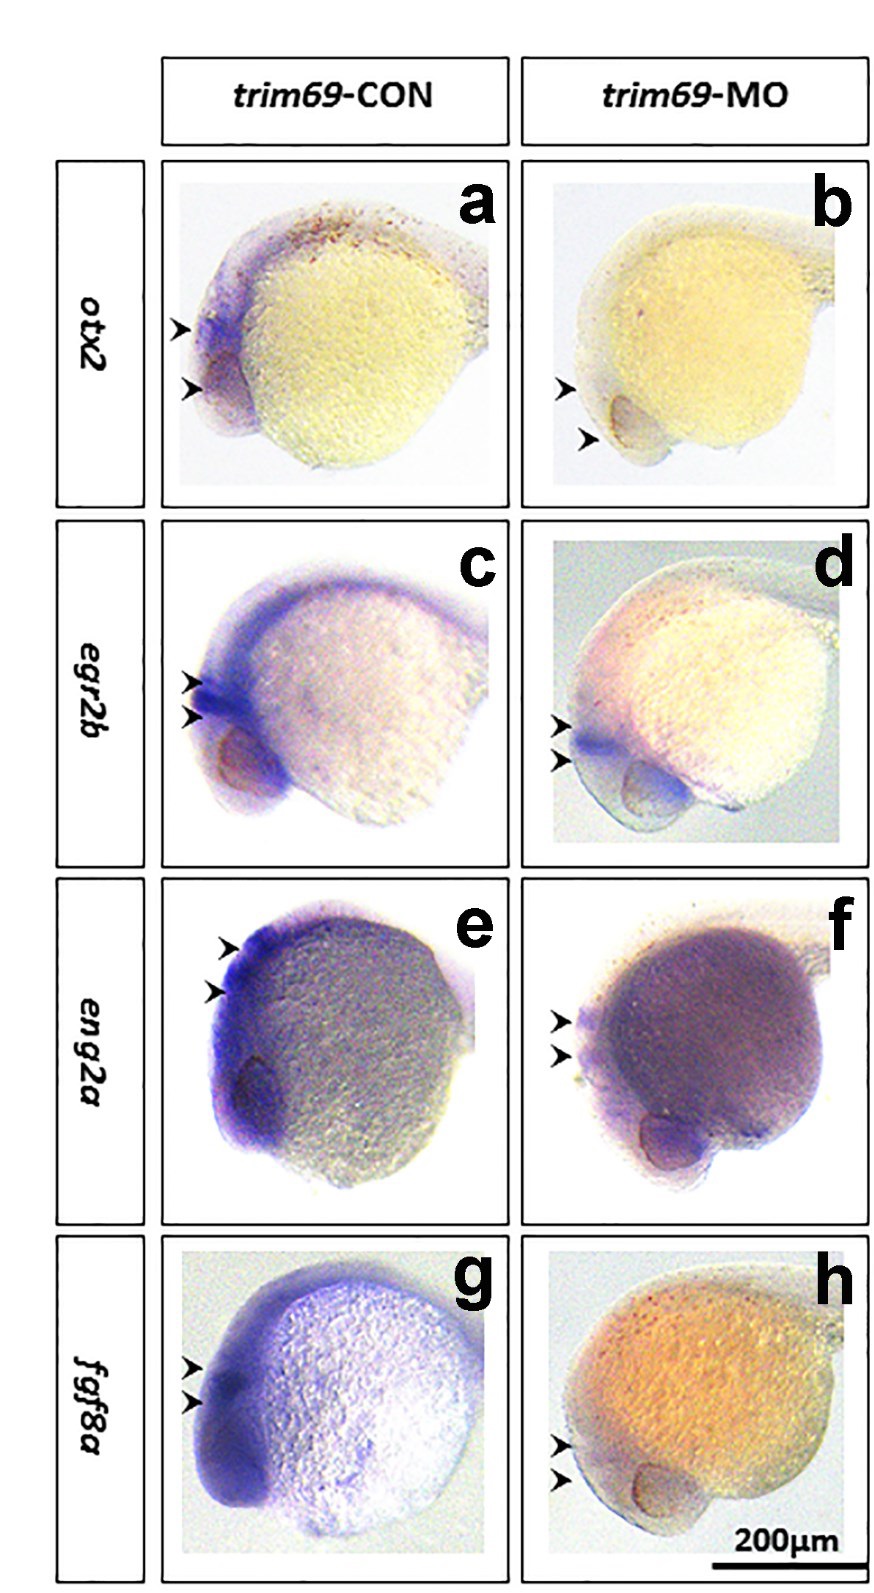
Fig. S4
Expression of brain region specific markers detected byin situhybridization. Detection of the expression ofotx2 (marker of forebrain and MHB), eng2a (marker for MHB and hindbrain), egr2b (marker for MHB and hindbrain), and fgf8a (marker for forebrain and MHB) after loss oftrim69 by in situ hybridization.trim69-CON: control group; trim69-MO: trim69 knocking down; black arrow indicates positive signals; scale bar: 200µm.
Figure Data
Acknowledgments
This image is the copyrighted work of the attributed author or publisher, and
ZFIN has permission only to display this image to its users.
Additional permissions should be obtained from the applicable author or publisher of the image.
Full text @ Sci. Rep.