
IMAGE
Fig. S1
- ID
- ZDB-IMAGE-151009-29
- Genes
- Publication
- Jia et al., 2015 - Mutation of kri1l causes definitive hematopoiesis failure via PERK-dependent excessive autophagy induction
- All Figures
- Figures for Jia et al., 2015
Image
|
Figure Caption
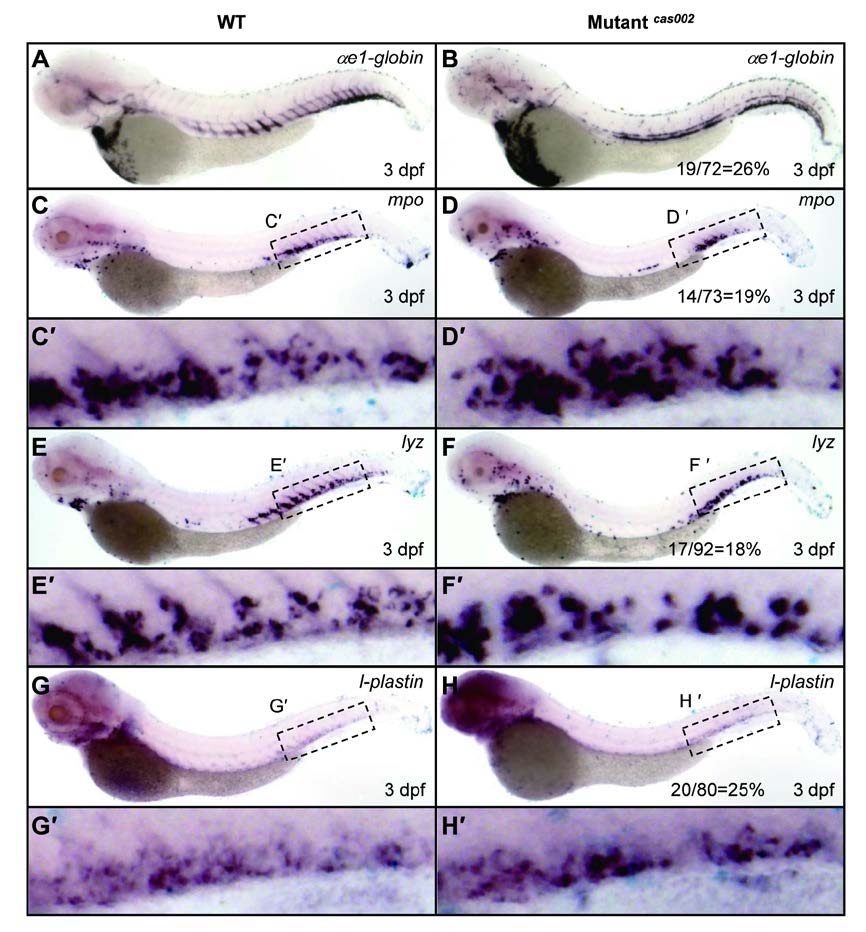
Fig. S1 WISH analysis of hematopoietic lineages at 3 dpf. WT or mutantcas002 embryos were fixed at 3 dpf, followed by WISH analysis of the expression of αe1-globin, mpo, lyz, l-plastin, respectively. αe1-globin (A-B), mpo (C-D), lyz (E-F) and l-plastin (G-H) expression show no significant difference between siblings and mutantcas002 at 3 dpf. (C′-H′) enlarged CHT regions in C-H. The number of embryos in a het-het incross clutch with the expression pattern as shown in the mutantcas002 column and corresponding percentages are listed inside each panel.
Figure Data
Acknowledgments
This image is the copyrighted work of the attributed author or publisher, and
ZFIN has permission only to display this image to its users.
Additional permissions should be obtained from the applicable author or publisher of the image.
Full text @ Cell Res.