
IMAGE
Fig. 4
- ID
- ZDB-IMAGE-150601-30
- Genes
- Publication
- Filipek-Górniok et al., 2015 - The Ndst Gene Family in Zebrafish: Role of Ndst1b in Pharyngeal Arch Formation
- All Figures
- Figures for Filipek-Górniok et al., 2015
Image
|
Figure Caption
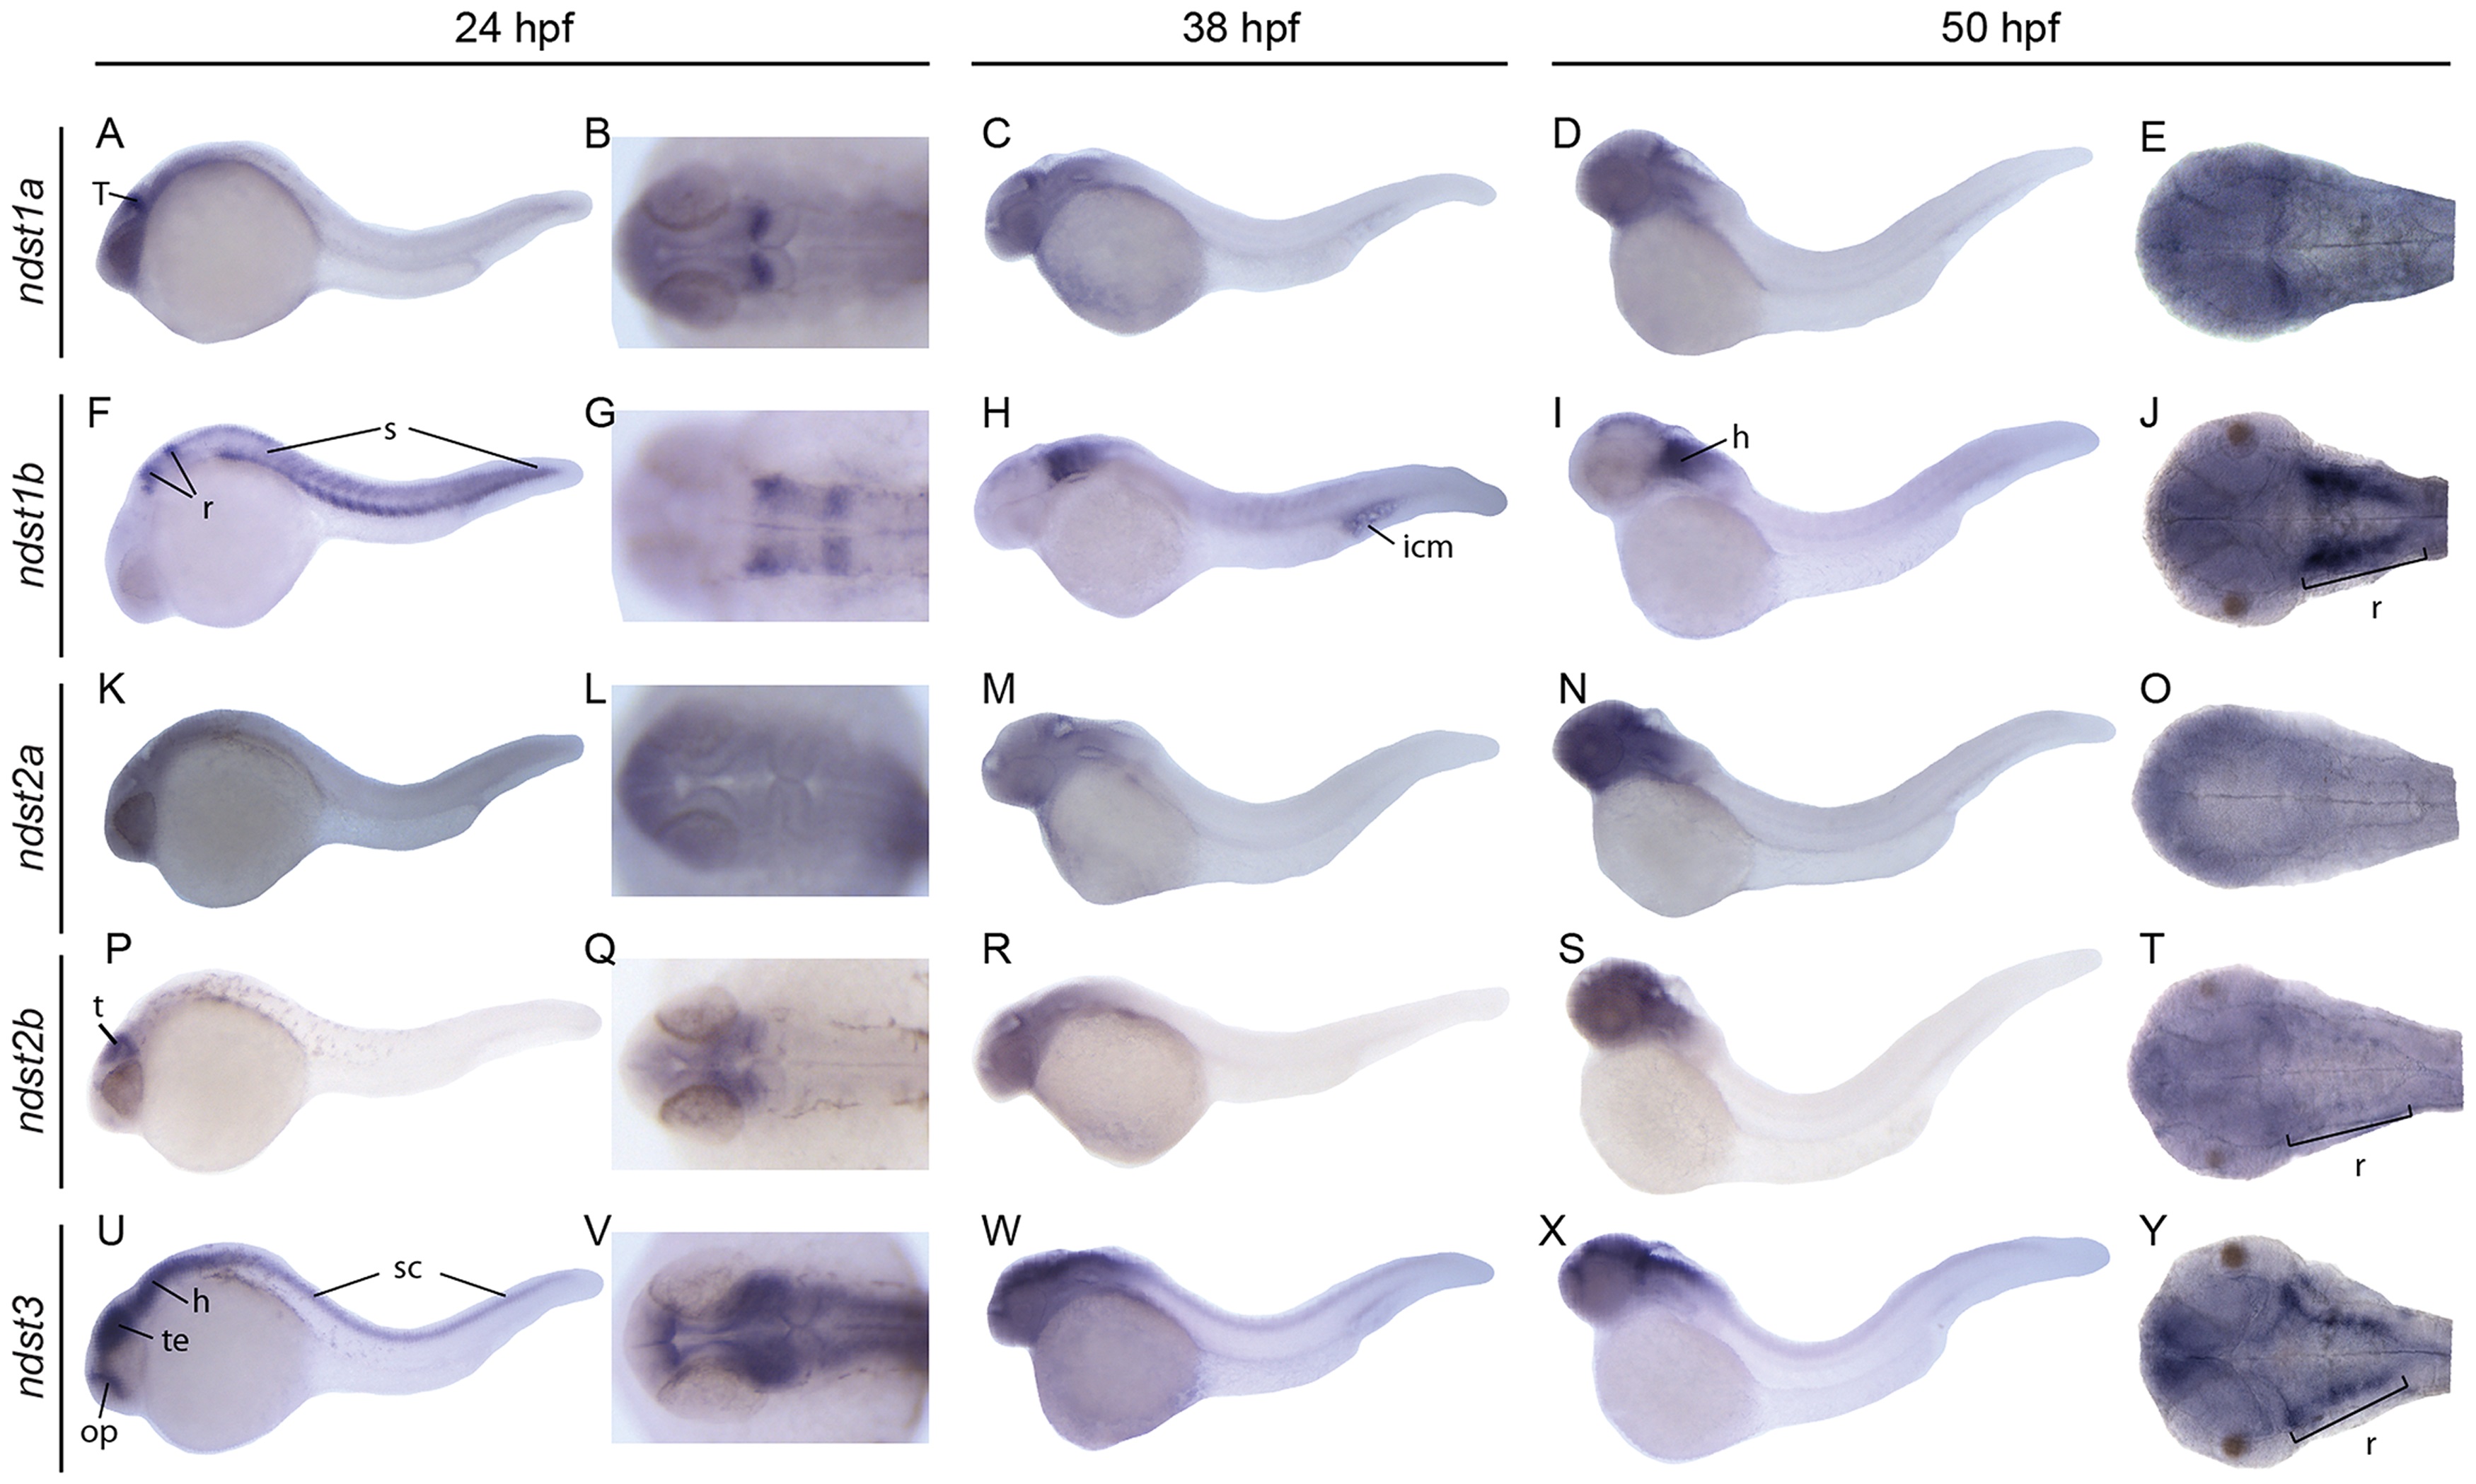
Fig. 4
Expression of zebrafish ndst genes at 24, 38 and 50 hpf.
Lateral and dorsal view of the embryos, or head region of the embryo. Embryonic expression patterns are shown for ndst1a: A-E; ndst1b: F-J; ndst2a: K-O; ndst2b: P-T; ndst3: U-Y. Abbreviations used: h, hindbrain; icm, intermediate cell mass (blood islands); op, olfactory placode and olfactory bulb; r, rhombomeres; s:, somites; sc, spinal cord; t, tectum; te, telencephalon.
Figure Data
Acknowledgments
This image is the copyrighted work of the attributed author or publisher, and
ZFIN has permission only to display this image to its users.
Additional permissions should be obtained from the applicable author or publisher of the image.
Full text @ PLoS One