
Fig. 6
- ID
- ZDB-IMAGE-140214-14
- Genes
- Antibodies
- Publication
- Dheen et al., 1999 - Zebrafish tbx-c functions during formation of midline structures
- All Figures
- Figures for Dheen et al., 1999
|
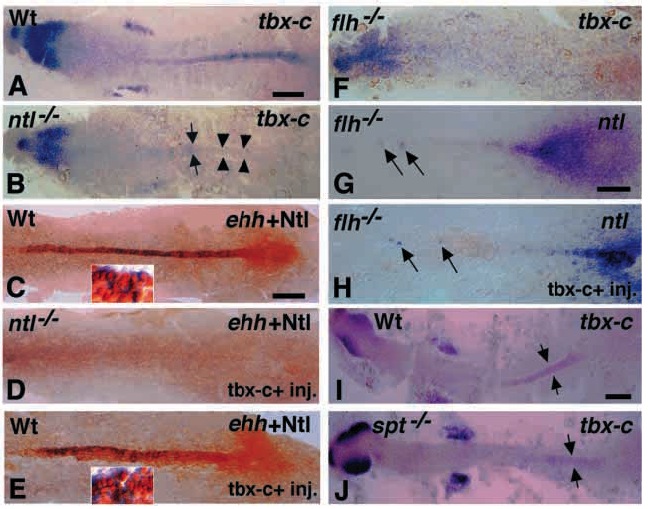
Fig. 6 Analysis of tbx-c expression and effect of ectopic expression of tbx-c+ in mutants. (A,B) Expression of tbx-c in wild-type (A) and ntl-/- mutant (B) embryos. Note the segregation of axial mesoderm (arrowheads) and a low level expression of tbx-c in the midline at the trunk of the mutant (arrows). (C-E) Co-localization of ehh (blue) and Ntl (brown) in wild-type (C), tbx-c+ injected ntl-/- (D) and normal sibling(E) embryos obtained by crossing heterozygous flh-/+ pair. Expression of both ehh and Ntl is expanded in the tbx-c+ injected wild-type sibling embryo (E) and absent in the tbx-c+ injected ntl-/- mutant embryo (D). (F) tbx-c expression in the flh-/- embryo. The notochord is absent and tbx-c is undetectable in the midline region of flh-/-embryo. (G,H) ntl expression in the flh-/- embryo (G) and the flh-/- embryo injected with tbx-c+ (H). A few ntl positive cells (arrows) can be seen in the midline of both group of embryos. (I,J) tbx-c expression in wild-type (I) and spt-/- embryos (J) at 14 hpf. Arrows indicate the tbx-c expression in the notochord. Insert (C,E): high magnification to show co-expression of ehh and Ntl in the notochord. Scale bars, 100 μm.