
Fig. 3
- ID
- ZDB-IMAGE-131211-44
- Genes
- Publication
- Kwon et al., 2013 - The parallel growth of motoneuron axons with the dorsal aorta depends on Vegfc/Vegfr3 signaling in zebrafish
- All Figures
- Figures for Kwon et al., 2013
|
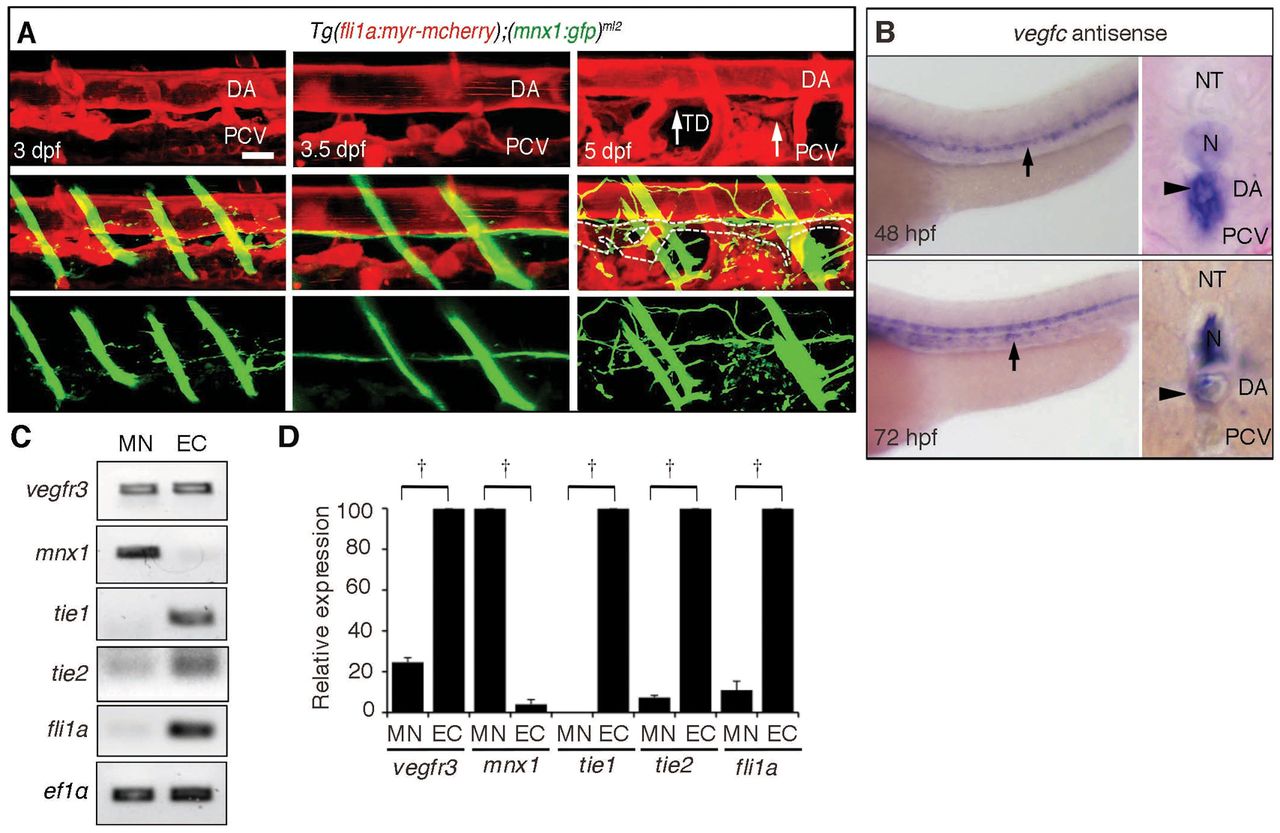
Fig. 3 Motoneurons express Vegfr3. (A) 3D-rendered confocal stack of fluorescence images (lateral view) of a Tg(fli1a:myr-mcherry);(mnx1:gfp)ml2 embryo at the times indicated in the top panels. Top panels, blood vessels and lymphatic vessels marked by mCherry; middle panels, merged images of GFP and mCherry; bottom panels, motoneurons marked by GFP. Arrows indicate the TD. Dashed lines in the middle panel indicate the outline of the TD. Note that the axon extension preceded TD development and that the axons were formed between DA and TD. Scale bar: 25 μm. (B) In situ hybridization analyses of vegfc mRNA in embryos at the indicated stages. Arrows and arrowheads indicate vegfc mRNA detected in the DA in the lateral views (left) and cross-section views (right), respectively. (C) RT-PCR analyses using the primers indicated at the left and RNAs prepared from the Tg(fli1a:myr-mcherry);(mnx1:gfp)ml2 embryos by FACS at 72 hpf. (D) Real-time quantitative RT-PCR analyses using RNAs prepared from embryos at 72 hpf by the primers as indicated at the bottom. †P<0.05. Error bars indicate s.d. DA, dorsal aorta; EC, endothelial cells; MN, motoneurons; N, notochord; NT, neural tube; PCV, posterior cardinal vein; TD, thoracic duct.