
Fig. 4
- ID
- ZDB-IMAGE-130429-36
- Genes
- Publication
- Wolf et al., 2013 - Specification of posterior hypothalamic neurons requires coordinated activities of Fezf2, Otp, Sim1a and Foxb1.2
- All Figures
- Figures for Wolf et al., 2013
|
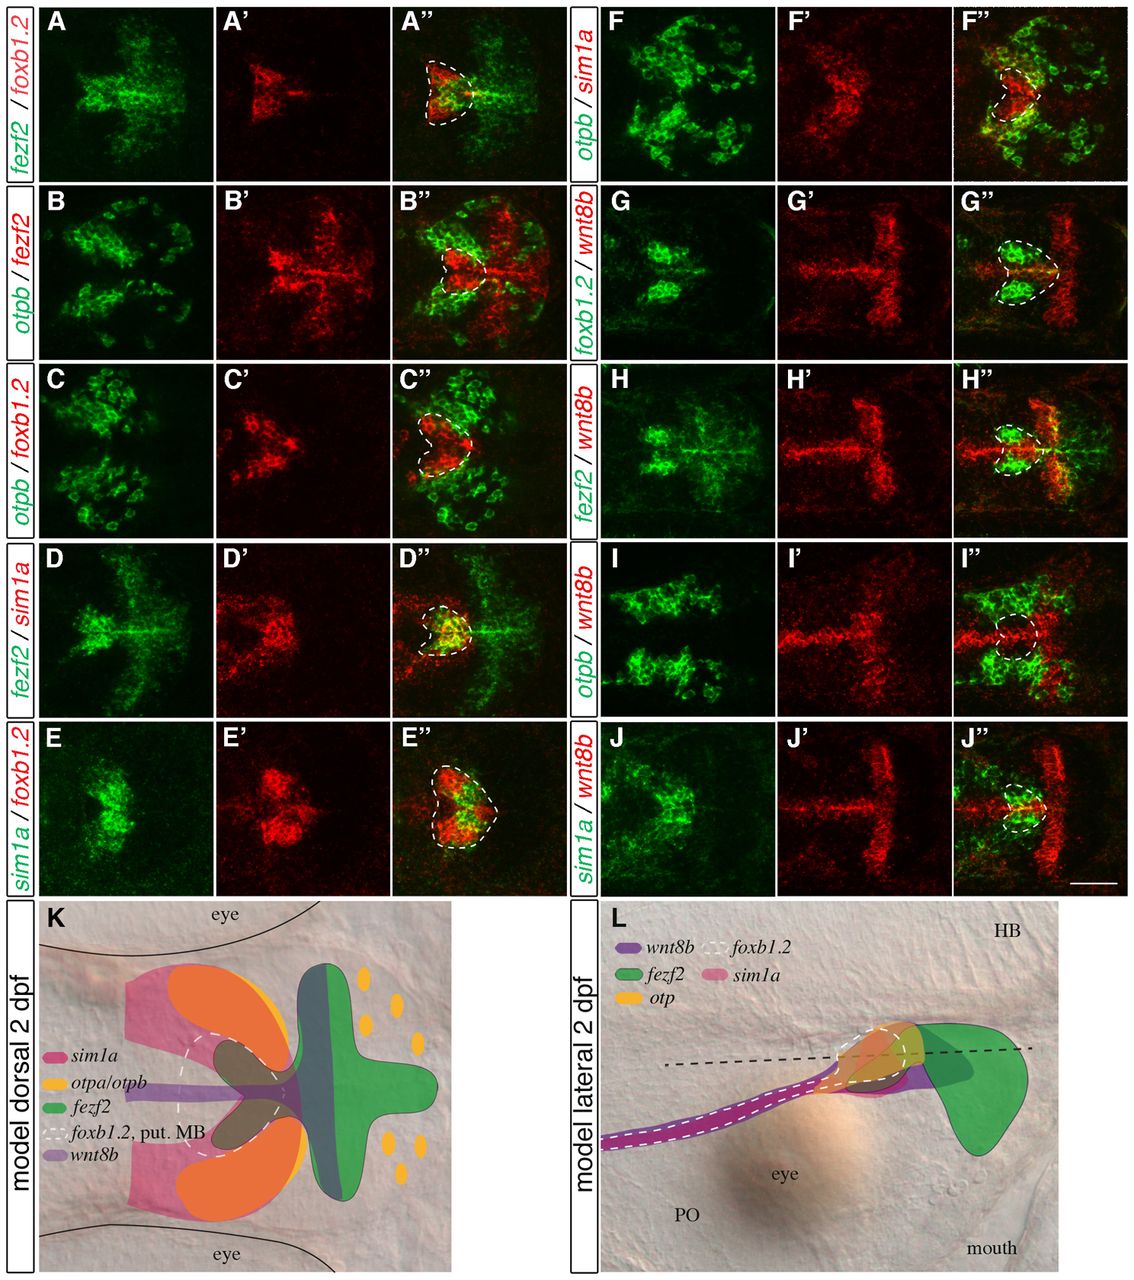
Fig. 4 The expression of foxb1.2, fezf2, otpb, sim1a and wnt8b in the MA. (A-J′′) Two-color FISH of 2-dpf wild-type zebrafish embryos with probes for otpb, sim1a, fezf2, foxb1.2 and wnt8b reveals their relative expression patterns in the MA. (A-A′′) Strong foxb1.2 expression marks the putative mammillary body (MB) where fezf2 expression partially overlaps but extends further posterior. (B-C′′) By contrast, otpb is expressed laterally and adjacent to fezf2 (B-B′′) and foxb1.2 (C-C′′). (D-D′′) fezf2 and sim1a are partially co-expressed in the putative MB. (E-E′′) sim1a partially overlaps with foxb1.2. (F-F′′) Lateral to the putative MB, sim1a is co-expressed with otpb. (G-J′′) wnt8b is expressed in the midline and in a domain posterior to the putative MB (G-G3) and is partially co-expressed with fezf2 (H-H′′), otpb (I-I′′) and sim1a (J-J′′). (K) Summary of the relative expression domains of foxb1.2, sim1a, otp, fezf2 and wnt8b in the dorsal view. The white dashed lines demarcate the putative MB. (L) Representation of the relative expression domains of foxb1.2, sim1a, otp, fezf2 and wnt8b in the lateral view. Dorsal views of maximum projections of 10-15 μm confocal stacks are shown. Scale bar: 60 μm.