
Fig. 4
- ID
- ZDB-IMAGE-121217-10
- Genes
- Antibodies
- Publication
- Nguyen-Chi et al., 2012 - Morphogenesis and Cell Fate Determination within the Adaxial Cell Equivalence Group of the Zebrafish Myotome
- All Figures
- Figures for Nguyen-Chi et al., 2012
|
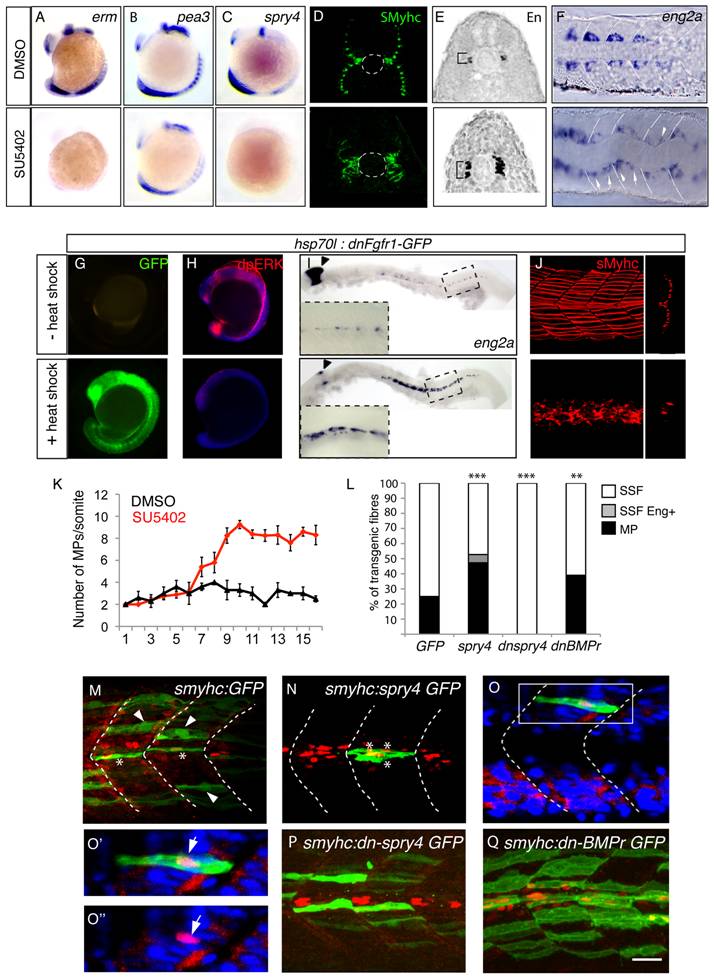
Fig. 4 sprouty4-mediated FGF inhibition promotes muscle pioneer formation.
Erm (A), pea3 (B) and spry4 (C) expressions in 10–13-somite embryos after DMSO or SU5402 treatments as determined by in situ hybridization. (D) sMyHC (green) and (E) Eng (black) expression in transverse sections of 1 dpf embryos, after treatment with DMSO or SU5402 applied at the 6-somite stage. (F) eng2a expression at 10-somite after treatment with DMSO or SU5402, as determined by ISH (Dorsal view, anterior towards the left). (G-J) Expression of a dominant negative form of fgfr1 fused with GFP (green) (G) is induced after heat shock in hsp70l:dnfgfr1-GFP embryos at 13–15-somite stage. (H) Expression of the target gene of FGF signaling cascade, diphosphorylated ERK (dpERK, red), which is down regulated in 13–15 somite embryos after heat shock compared to no heat shocked control. By contrast (I) eng2a is up-regulated at 1 dph after heat shock as revealed by ISH and (J) slow fibre migration is impaired, as revealed by 3D reconstructed sMyHC expression (lateral view and cross section). (K) Graphic representation of the number of MPs per somite in 1 dpf embryos after treatment with DMSO or SU5402 applied at the 10-somite stage. The horizontal axis represents the position of the somite along the body axis, 1 being the most rostral somite, values = means, error bars = standard error of the mean (s.e.m.). (L-Q) Ectopic expression of spry4, dn-spry4 or dn-BMPr in slow precursors was obtained after injection of (L, N, O, O′, O′′) smyhc:spry4-ires-GFP, (L, P) smyhc:dn-spry4-ires-GFP and (L, Q) smyhc:dn-BMPr-GFP DNA constructs into one cell embryo, respectively. (L, M) smyhc:GFP construct was used as the injection control. (L) Graphic representation of the different fates of transgenic slow fiber (SSF, MP and SSF en+) upon ectopic expression of GFP, spry4, dnspry4 or dnBMPr. Values = means of percentages of transgenic muscle fibers per injected embryo (nembryo = 6–9 per condition). We performed analysis of variance (ANOVA) to determine statistical difference within a 95% confidence interval: ** p<0.005, ***p<0.001. (M–Q) Images reveal the expression of GFP (green) and Eng (red) in the somites of 1 dpf embryos by maximum projections of multiple confocal scans (M, N, P, Q) or single confocal scan (O–O′′). SSFs (arrow heads) and MPs (*) are indicated. (O–O′′) In 4.19% of cases, the spry4 transgene triggers expression of Engrailed in post-migratory slow fibers (arrows, p<0.05). (O′, O′′) high magnification of the region boxed in O. Scale bar = 25 μm.