
IMAGE
Fig. 8
- ID
- ZDB-IMAGE-100319-3
- Genes
- Publication
- Tingaud-Sequeira et al., 2010 - The zebrafish genome encodes the largest vertebrate repertoire of functional aquaporins with dual paralogy and substrate specificities similar to mammals
Image
|
Figure Caption
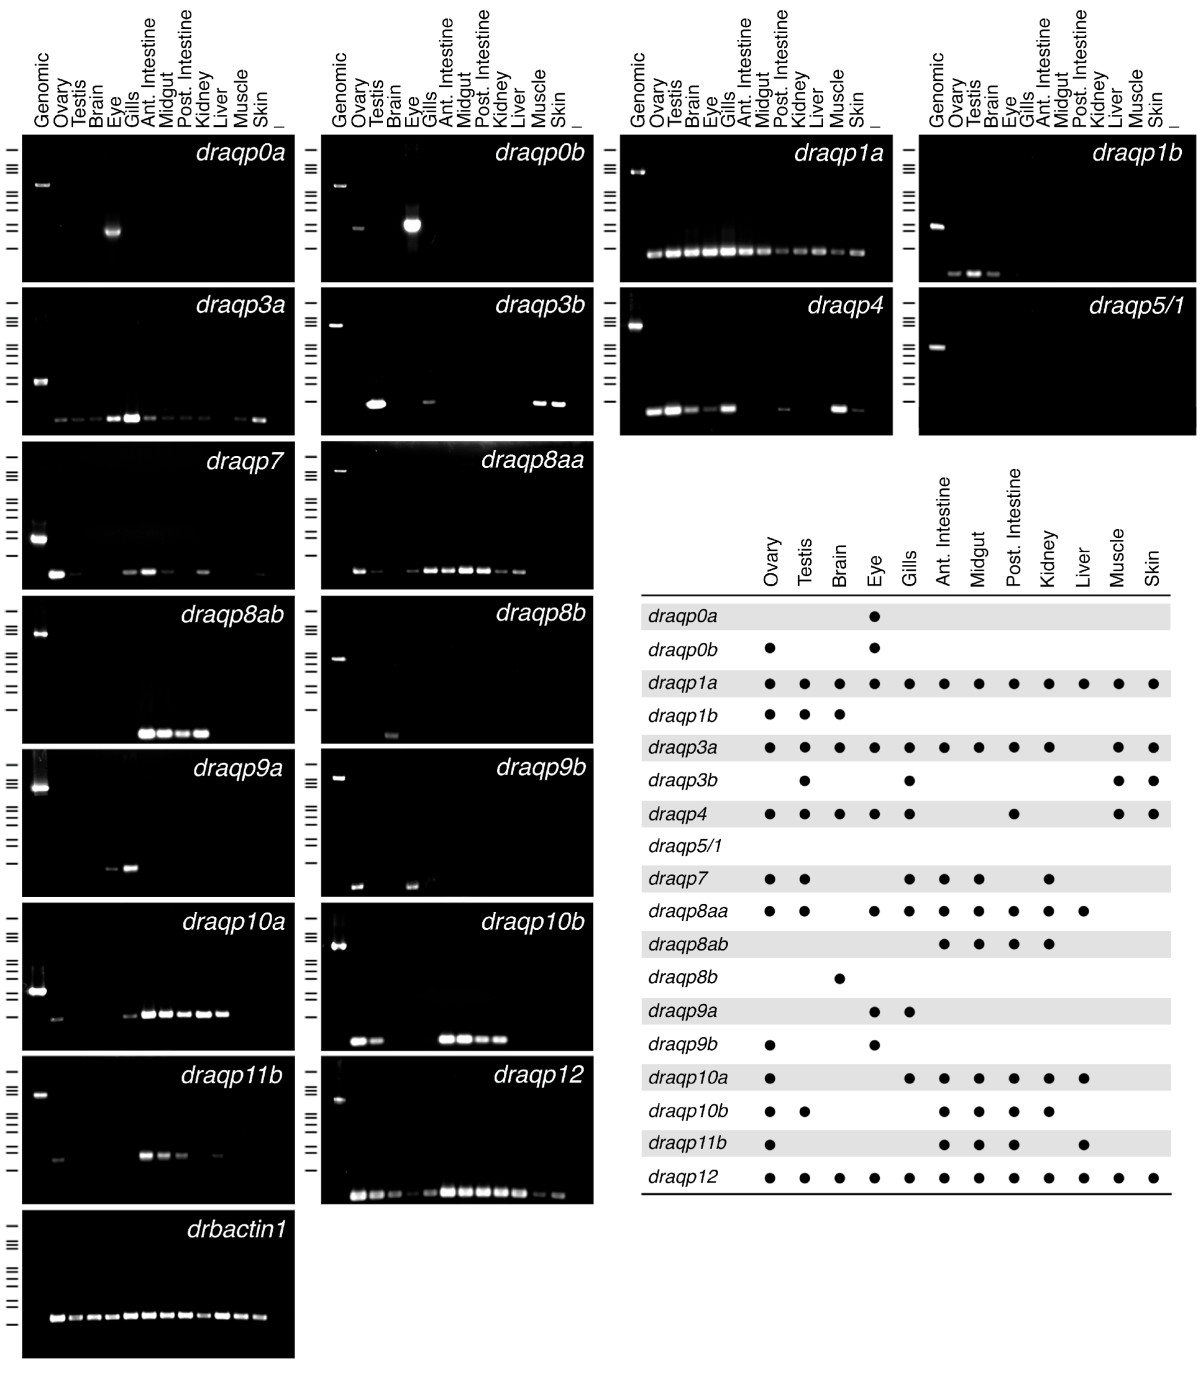
Fig. 8 Aquaporin gene expression in adult tissues of zebrafish. Representative RT-PCR analysis of aquaporin and b-actin1 (drbactin1) transcripts. PCR on genomic DNA was used as control. Minus indicates absence of RT during cDNA synthesis. The size (kb) of PCR products and molecular markers are indicated on the left; from top to bottom: 21.23, 5.15, 4.27, 3.53, 2.03, 1.91, 1.58, 1.37, 0.95, 0.83 and 0.56. A summary of the presence or absence of the aquaporin transcripts in the different tissues is shown to the lower right.
Figure Data
Acknowledgments
This image is the copyrighted work of the attributed author or publisher, and
ZFIN has permission only to display this image to its users.
Additional permissions should be obtained from the applicable author or publisher of the image.
Full text @ BMC Evol. Biol.