
Fig. 1
- ID
- ZDB-IMAGE-090602-21
- Genes
- Publication
- Warga et al., 2009 - Fate mapping embryonic blood in zebrafish: multi- and unipotential lineages are segregated at gastrulation
- All Figures
- Figures for Warga et al., 2009
|
Fig. 1
Characterization of Embryonic Blood
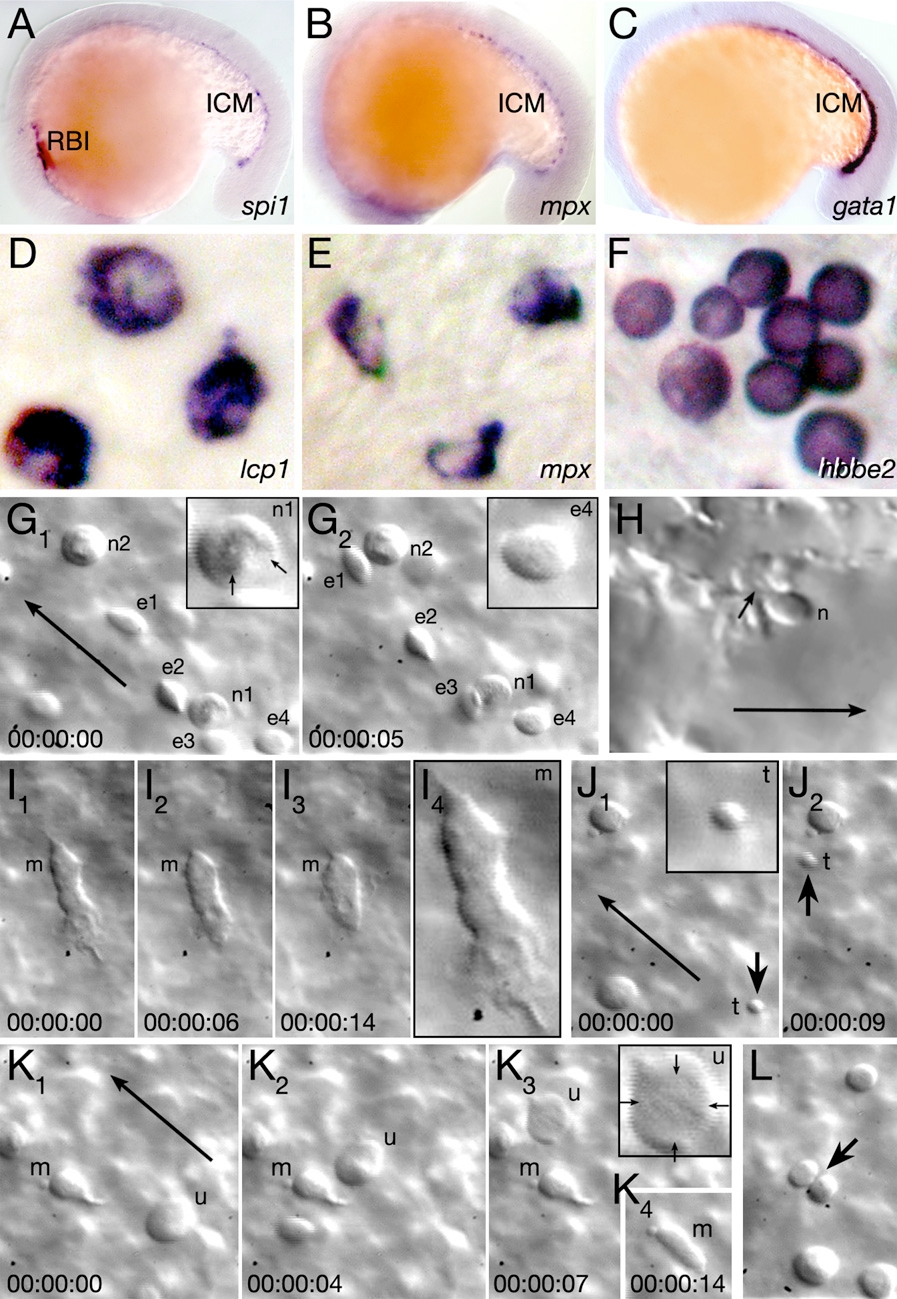
(A–C) The rostral blood island (RBI) and intermediate cell mass (ICM) at 18 hr, visualized with (A) a myeloid marker, (B) a neutrophil marker, and (C) an erythroid marker. (D–F) Individual blood cells at 26 hr, visualized by in situ hybridization: (D) macrophage cells, (E) neutrophil cells, and (F) erythrocyte cells. (G–L) Individual blood cells in the live 30 hr embryo. Each image is a single frame from a real-time recording of circulating blood. Elapsed time is indicated in the lower frame, long arrows indicate the flow of circulation, and insets show a 200x-magnified view of specific cells. (G and H) Neutrophils (n) and circulating erythrocytes (e) in the (G) viteline vein over the yolk sac and in the (H) lumen of a tail blood sinus. The arrows in (G1) indicate individual nuclear lobes of a neutrophil, and the small arrow in (H) indicates where the neutrophil anchors itself to the endothelial lumen. (I) A macrophage (m) patrolling the viteline vein. The last panel is magnified 200x. (J) A circulating thrombocyte (t and arrow). (K and L) Unidentified cells. (K) A large rare cell type (u), arrows in the inset indicate its diffuse nuclear envelope. A macrophage (m) is also visible in (K). (L) A dividing cell (arrow).
Reprinted from Developmental Cell, 16(5), Warga, R.M., Kane, D.A., and Ho, R.K., Fate mapping embryonic blood in zebrafish: multi- and unipotential lineages are segregated at gastrulation, 744-755, Copyright (2009) with permission from Elsevier. Full text @ Dev. Cell